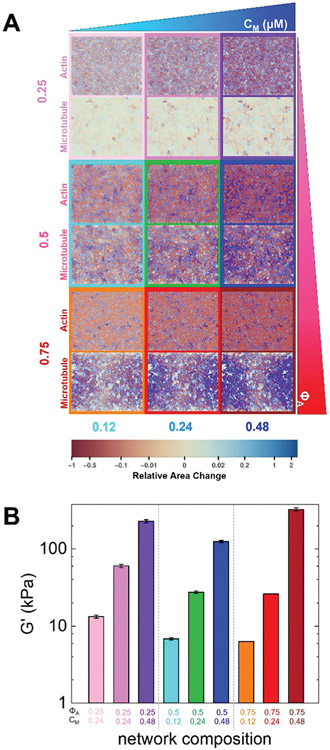
Fig. 4.
Active double-network modeling shows tunable restructuring and rigidity of myosin-driven actin–microtubule composites. (A) Heat maps for strains experienced by actin and microtubule networks in the active double-network model for myosin concentrations and molar actin fractions shown in Fig. 1. Contractile strains are shown in shades of red and extensile strains are shown in shades of blue, with darker colors representing larger strains, as described by the color scale which maps the color to the fractional change in area of each ~1 μm2 region of the network. The strain maps for the actin network and microtubule network for each condition are shown in the top and bottom of each panel, respectively. Simulation box size is 88 × 72 μm for all images. (B) Elastic modulus G′ of a simulated active double-network for parameters shown in Fig. 1B. The values shown are the average and standard error over 5 simulation runs.

