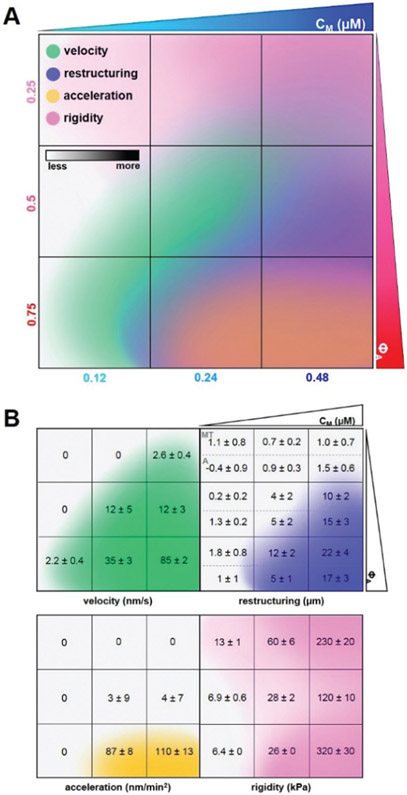
Fig. 6.
Cartoon phase diagram of active cytoskeleton composite dynamics mapped to the corresponding composite formulation (ΦA, cM) highlights tunability and desirable properties of active composites. (A) Comprehensive phase diagram showing how myosin-driven composite velocities (green, determined from DDM), restructuring (blue, determined via SIA), acceleration (yellow, determined from time-resolved DDM), and rigidity (pink, determined via double-network simulations) vary in formulation space (ΦA, cM). Darker shading of each color qualitatively indicates increasing metric values quantified within the separated figures in (B). Velocities are averaged over both actin and microtubule channels as we observed similar dynamics for both filaments in all cases. Degree of restructuring is calculated by taking the difference in final and initial correlation length (Δλ = λfinal − λinitial), and is reported separately for microtubules (top, MT) and actin (bottom, A) because we observed instances of significant differences in Δλ for the two filaments. Acceleration is calculated by computing the average change in velocity over time. Rigidity is calculated by performing simulations under 0.005% shear to obtain the elastic modulus G′. Composites with ΦA = 0.5 and sufficiently high cM exhibit coordinated contractile dynamics and rearrangement without destructive network acceleration or decorrelation of actin and microtubule restructuring.

