Figure 6.

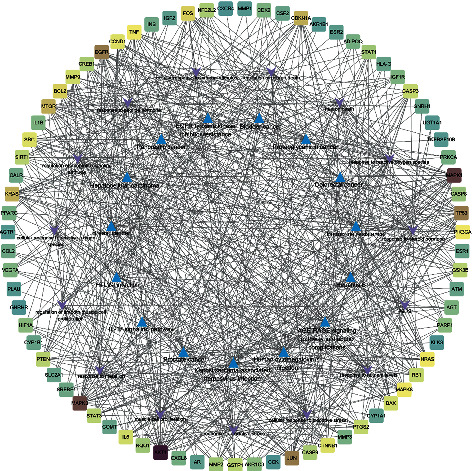
Core target-biological process-signal pathway network. The square represents DXP anti-EC targets, the triangle represents the top 15 signaling pathway, and the arrow represents the top 15 biological processes.

Core target-biological process-signal pathway network. The square represents DXP anti-EC targets, the triangle represents the top 15 signaling pathway, and the arrow represents the top 15 biological processes.