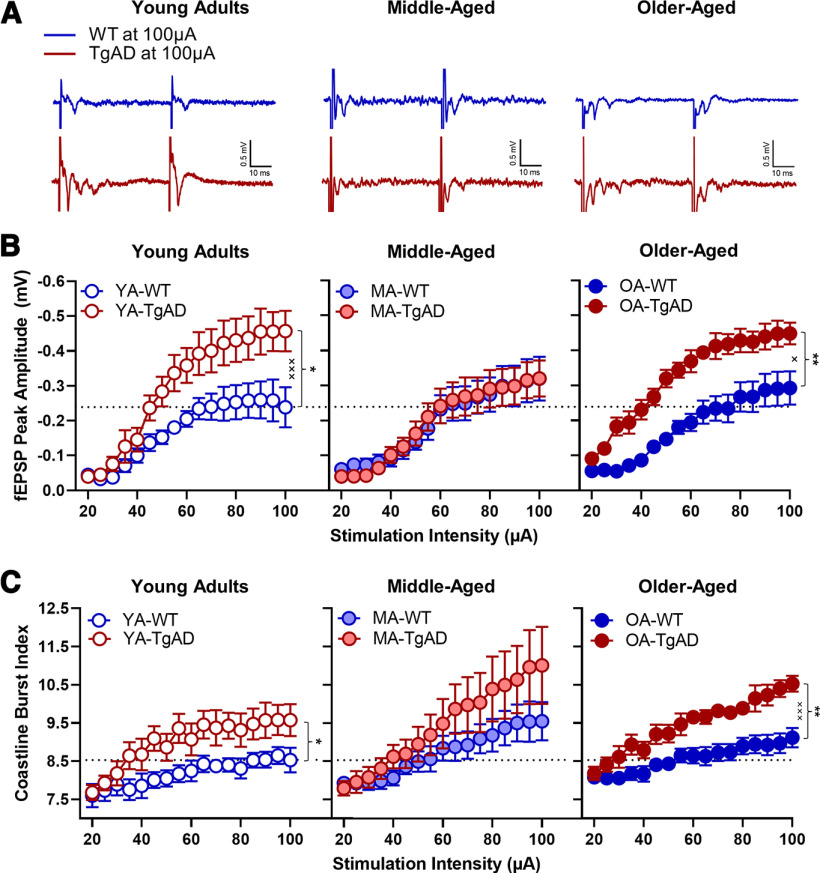
Figure 4.
fEPSP peak amplitude responses to increasing stimulation intensity. A, Representative traces for each group at maximum simulation intensity (100 μA). B, fEPSP peak amplitudes within age groups. Within the young adults, there was a significant main effect of genotype and a significant genotype × intensity interaction such that TgAD rats had greater peak amplitudes at higher stimulation intensities relative to WT rats. There were no differences between WT and TgAD rats within the middle-aged group. Within the older-aged group, there was a significant main effect of genotype and a significant genotype × intensity interaction such that TgAD rats had greater peak amplitudes at higher stimulation intensities relative to WT rats. There was also a significant age × genotype interaction. C, The coastline burst index for each age group. Within the young adults, there was a significant main effect of genotype such that TgAD rats had greater BA activity. There were no genotypic differences among the middle-aged rats. Within the older-aged group, there was a significant main effect of genotype and a significant genotype × intensity interaction such that older-aged TgAD rats had greater activity at higher stimulation intensities relative to WT rats. There was also a trending age × intensity interaction regardless of genotype. Data are plotted as the mean with SEM. *p < 0.05, **p < 0.01 for main effects of genotype; ×p < 0.05, ×××p < 0.001 for genotype × intensity interactions. Dotted black line represents mean of YA-WT at 100 μA.

