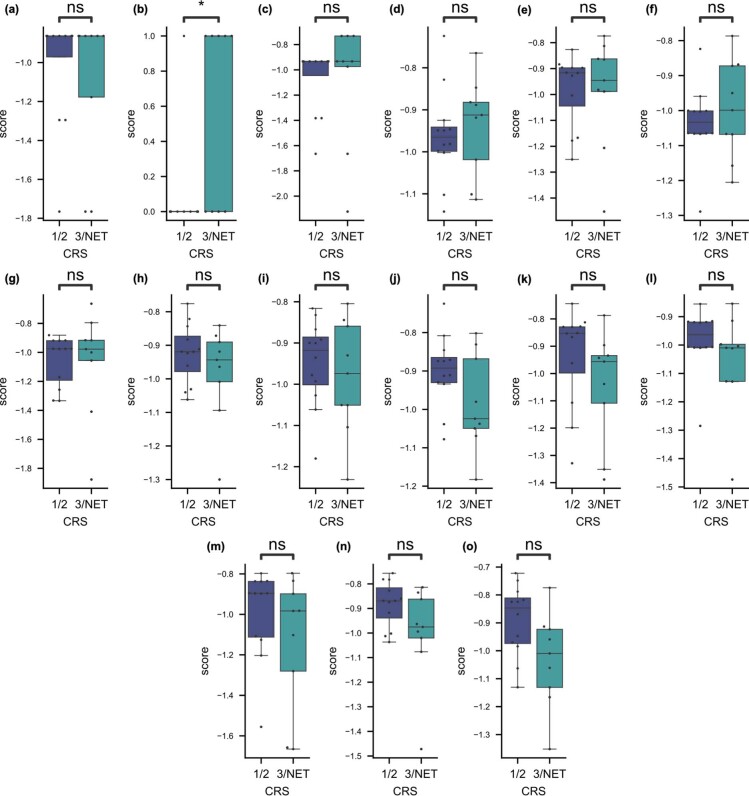
Extended Data Fig. 10. Chemotherapy response scores for all models on the test set.
a–o, for C, G, GC, GH, GHC, GR, GRC, GRH, GRHC, H, HC, R, RC, RH, and RHC models, respectively. The box of each plot depicts the 25th, 50th, and 75th percentiles, and the whiskers depict the entire range except for outlier points beyond 1.5 times the interquartile range past from the median 50% of data. Significance was assessed by a one-sided Mann-Whitney U test without correction for multiple tests. * denotes p < 0.05, ** denotes p < 0.01, ns denotes p > 0.05. P-value in b is 0.012. Each plot depicts N = 9 patients with CRS 3/NET and N = 12 patients with CRS 1/2.

