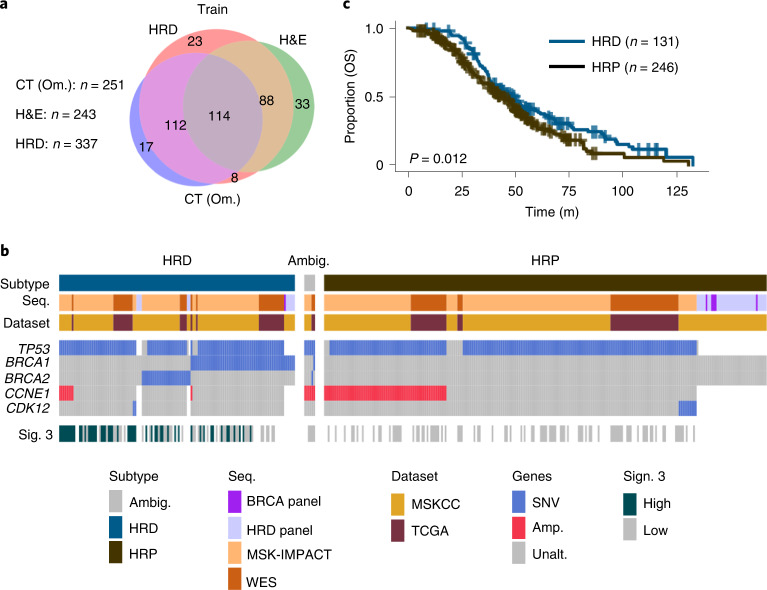
Fig. 2. Overview of cohorts and data types acquired.
a, Venn diagram of patients in the training cohort with available clinical imaging and inferred HRD status. b, Inferred subtypes, sequencing modality, dataset of origin, genes with five or more variants and signature 3 status of each patient. Gray represents sequenced genes without the aberrations shown and white represents an unsequenced gene. c, Kaplan–Meier analysis on OS stratified by HRD status (n = 377 patients). P values were calculated using the log-rank test. Sig., mutational signature; SNV, single-nucleotide variation; Amp., copy number amplification; WES, whole-exome sequencing.

