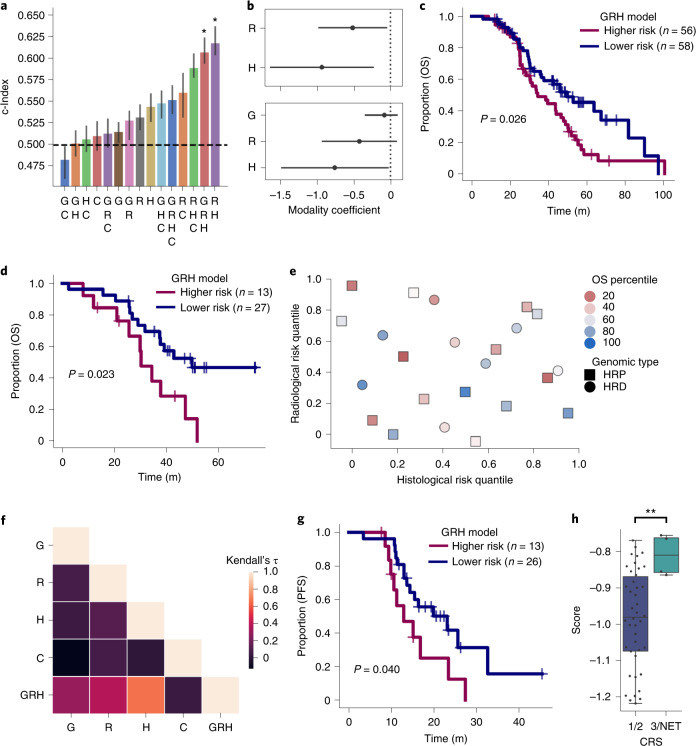
Fig. 6. Multimodal integration improves stratification and identifies clinically significant subgroups.
a, The test c-Indices for integration of combinations of multimodal features is shown: the height of each bar shows the c-Index and the lower and upper points of the respective error bars depict the 95% CI by 100-fold leave-one-out bootstrapping. Asterisks denote 95% confidence of significant ordering of the test set by 1000-fold permutation test. b, Log HRs of imaging without (top) and with (bottom) HRD integration. Two modalities are shown fitted on n = 122 patients (top) and three are shown fitted on n = 114 patients (bottom). c, Kaplan–Meier plot comparing high- and low- risk groups determined by the GRH model on the training set. P value calculated using the log-rank test. d, Kaplan–Meier plot comparing high- and low- risk groups test set. P value calculated using a log-rank test. e, Unique patients at risk of early death are identified by radiological, histopathological and genomic modalities. Only patients in the test set with uncensored outcomes (n = 23 patients) are shown. f, Kendall rank correlation coefficient of the risk quantile across pairs of the individual modalities, indicating low mutual ordering information between individual modalities in the training set. g, Kaplan–Meier plot of GRH model risk groups on PFS in the test set (one patient has unknown PFS.) P value calculated using the log-rank test. h, Distributions of GRH model score of low (blue) and high (green) CRS in the training set (n = 46 patients). Boxes denote interquartile range, with the center depicting the median and the whiskers denoting the entire distribution excluding any outliers. Significance was assessed by a one-sided Mann–Whitney U-test: P = 0.0044; **P < 0.01. perm.; permutation test; G, genomic model; H, histopathological model; R, radiological model; C, clinical model; NET, no evidence of tumor.

