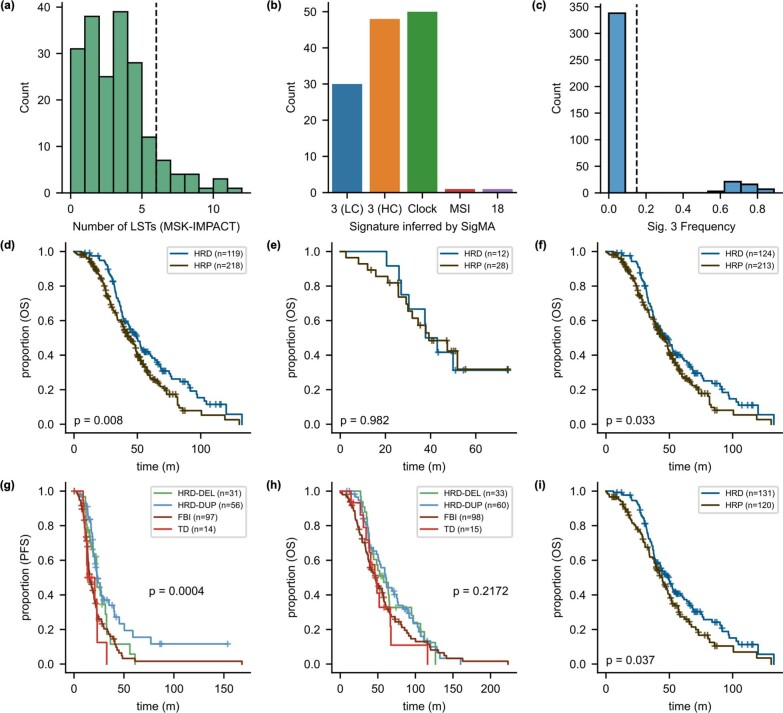
Extended Data Fig. 2. Genomic features of the training and test sets.
a, Distribution of large-scale state transitions and threshold. b, Signature 3 detections by SigMA with high confidence (HC; N = 48 patients) and low confidence (LC; N = 30 patients), Clock signature (N = 50 patients), Signature 18 (N = 1 patient), and MSI (N = 1 patient). (c) Signature 3 frequencies for all TCGA-OV cases with sequencing from43 are shown. 338 patients with low Sig. 3 and 47 with high Sig. 3. d,e Kaplan–Meier analyses of patients by genomic subtype in the training and test sets (p-value by log-rank test). f, Incorporating thresholded LST counts as indicators of HRD status did not increase the difference in OS of the HRD and HRP curves (p-value by log-rank test). g, Stratification by PFS using specific mutational subtypes: HRD-Deletion (HRD-DEL), HRD-Duplication (HRD-DUP), Foldback Inversion (FBI), and Tandem Duplications (TD) (p-value by multivariate log-rank test). h, Stratification by OS using the same mutational subtypes (p-value by log-rank test). i, Kaplan–Meier analysis by OS for only patients with explicit evidence of HRD or HRP, excluding presumed HRP (p-value by multivariate log-rank test).

