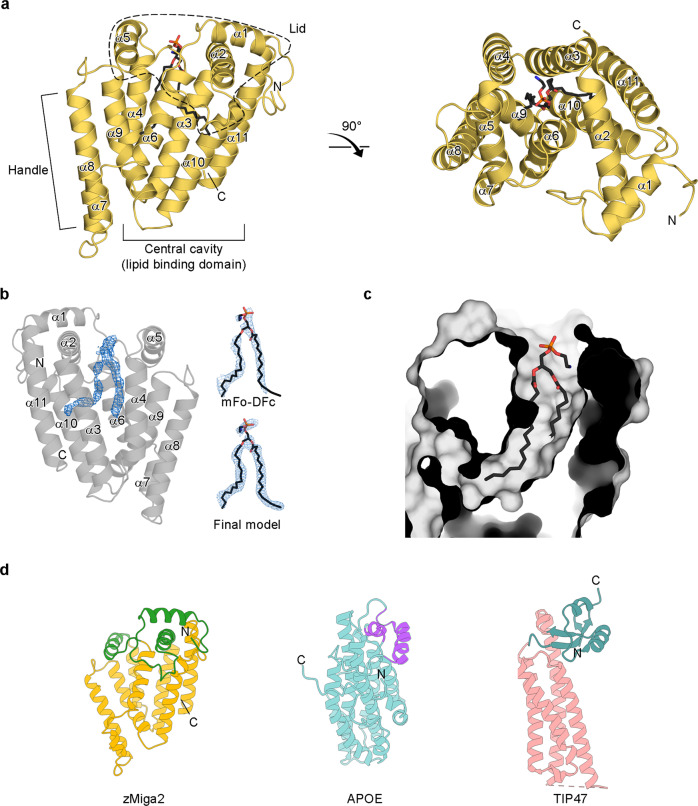
Fig. 2. Overall structure of zMiga2.
a Ribbon representation of the zMiga2 (yellow orange). The structure was determined by Se-SAD phasing and refined to 2.85 Å resolution. The overall structure is reminiscent of a mug. The lid is highlighted by dashed lines. The handle protrudes on the left. The black stick model indicates the phospholipid bound to zMiga2. Phosphate, nitrogen, and oxygen atoms are colored in orange, blue, and red, respectively. b The crystal structure of zMiga2 revealed extra electron density (blue, 2.85 Å resolution, contoured at 1.5 σ), which seemed to be that of a glycerophospholipid (left). Based on the density, we built a PE model with two 16:0 hydrocarbon chains. The final model is shown with the fo-fc map (right top) and 2fo-fc map (right below). The fo-fc map was calculated in the absence of the lipid model and countered at 1.5 σ. The 2fo-fc map is contoured at 0.8 σ. c A protein surface cutaway view shows a large cavity in zMiga2. The structure of PE is shown as a stick representation. d A ribbon diagram shows a structural comparison of lid and helix bundle structure of zMiga2 (lid: green; helix bundle: yellow orange), APOE (lid: purple; helix bundle: cyan) (PDB ID: 2L7B), and TIP47 (lid: teal; helix bundle: pink) (PDB ID: 1SZI).

