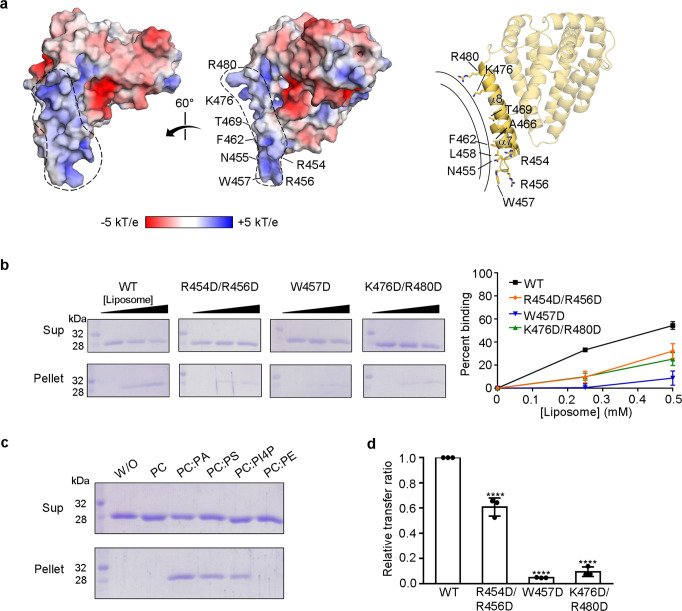
Fig. 6. zMiga2 docks with the membrane through a positively charged concave surface.
a Molecular surface of the zMiga2, colored according to electrostatic potential. The two views are 60° rotation around a vertical axis. The electrostatic potential was calculated with the APBS program57 and colored from −5 (red) to +5 (blue) kT/e (k, Boltzmann’s constant; T, temperature; e, charge of an electron). The membrane-associated region of zMiga2 is highlighted by dashed lines. A ribbon diagram on the right panel (in the same orientation as the middle panel) shows key residues involved in the association with the membrane. b Liposome sedimentation assay showing the direct membrane association of zMiga2. The experiments using wild type and mutants (R454D/R456D, W457D, and K476D/R480D) of zMiga2 were performed as shown in Fig. 1c. The right panel shows the quantification data using left (N = 3 independent experiments; dot shows mean ± SD). c Liposome sedimentation assay using a series of liposomes (PC, PC:PA, PC:PS, PC:PI4P, and PC:PE) (N = 2 independent experiments). d A graph comparing the transfer ratio between zMiga2 WT and each mutant (R454D/R456D, W457D, and K476D/R480D). Lipid transfer activity was compared with that of WT using one-way ANOVA (N = 3 independent experiments; individual data point shown as dots, bars show mean ± SD). ****p < 0.0001 (R454D/R456D, W457D, and K476D/R480D). Source data are provided in a Source data file.

