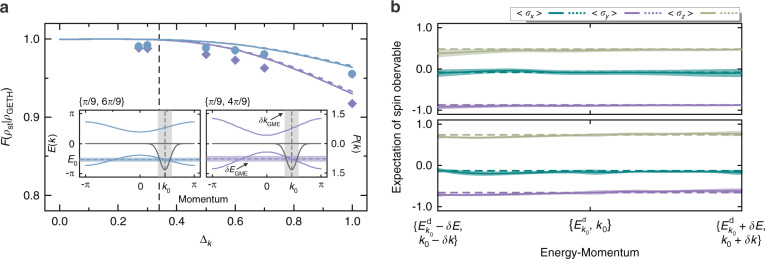
Fig. 4 . Verifying the generalized eigenstate thermalization hypothesis.
a Fidelity between the measured steady state and GME prediction against the standard deviation Δk for a walk with (blue circles) and (purple diamonds) . The colored dashed and solid lines represent the theoretical simulations for the steady state estimated by and , respectively. The dashed black line represents the upper bound of the initial Δk; below this line, the fidelity always approaches 1. The insets illustrate the effective band structures (colored solid lines with left-hand scale) and occupations of the initial state (with as an example) on the two bands (gray curves with right-hand scale). The expectation of the energy and momentum of the initial state is E0 and k0, respectively. In the insets, the vertical gray regions and horizontal colored regions show the chosen momentum window with and associated energy window. b Measured expectations of the three spin observables of the reconstructed spinor eigenvectors within the chosen energy-momentum window. The upper and lower panels show the results for and , respectively. The colored dashed lines give the theoretical results for , and the translucent shadings illustrate the statistical errors

