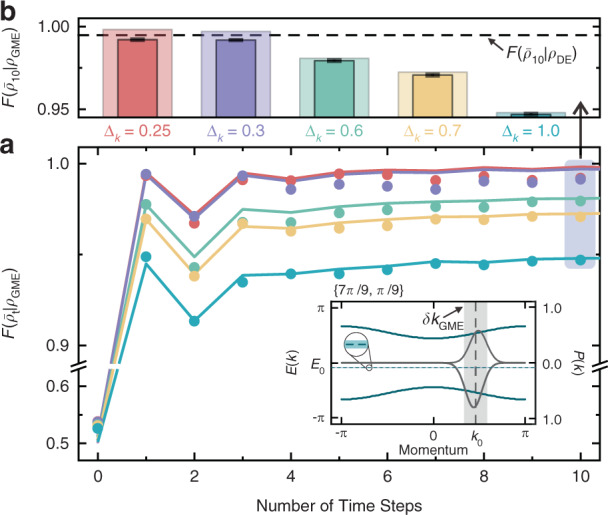
Fig. 5 . Observing the generalized thermalization.

a Fidelity (dots) between the measured time-averaged coin states and GME prediction against the time steps, and b their values (opaque bars) after a ten-step walk. The initial Gaussian states have five different widths Δk but the same coin state , and then evolve governed by . The colored solid lines in (a) and transparent bars in (b) represent the theoretical simulations. The inset in (a) shows the effective band structures (solid green lines with left-hand scale), the occupations of the two bands for one initial state with as an example (gray curves with right-hand scale). The expected energy and momentum of the initial state is E0 and k0, respectively. After expanding the initial state, the shift of the mean momentum of each band occupation relative to the k0 takes the following form: , where denotes the order of the function. Moreover, the vertical gray and horizontal green regions depict the chosen momentum window with and associated energy window, respectively. The dashed line in (b) indicates the lower bound (99.42%) of the measured
