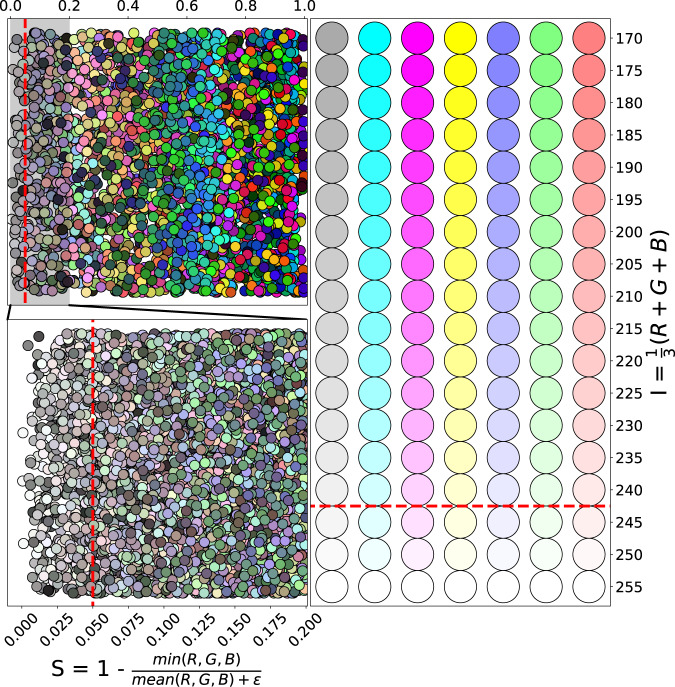
Fig. 1.
Visualization of the saturation and intensity based patch quality filter. Top Left: saturation was calculated for various RGB colors. The red dashed line shows the used threshold value 0.05, which is clearly a permissive cutoff. Bottom Left: Zoomed to the highlighted 0.0–0.2 region. ε = 10−8 is needed for numerical stability. Right: intensity plotted for a few RGB colors, the colors are considered burnout if their intensity is over 245. On the figure the red dashed line separates the burnout colors.

