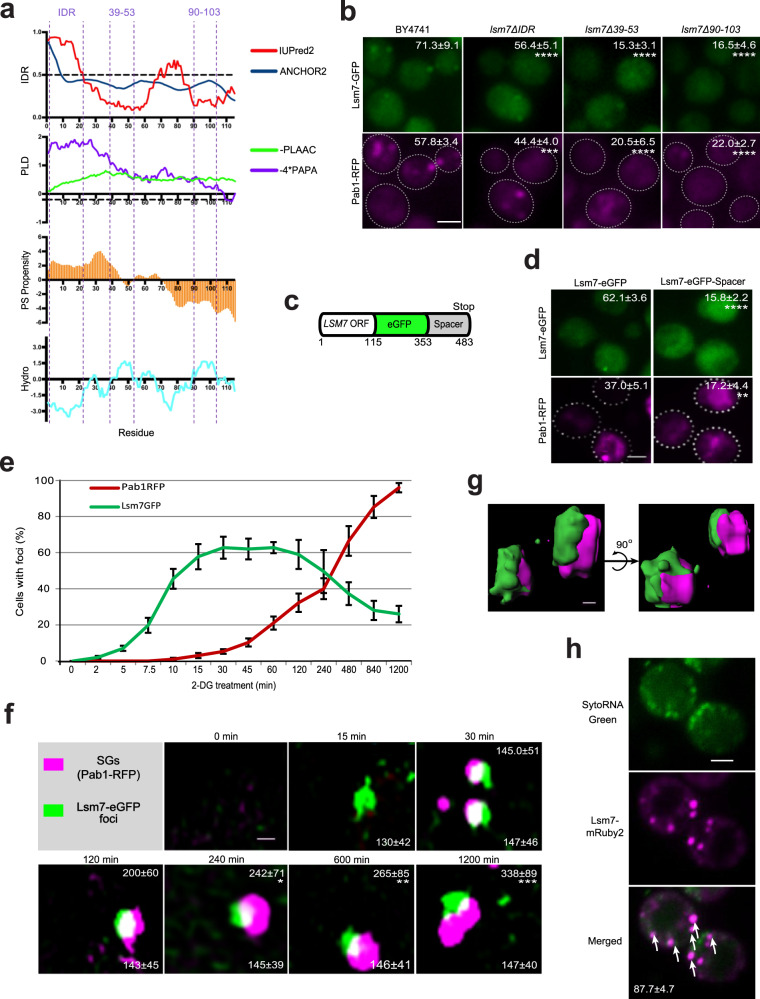
Fig. 4. Lsm7 foci formation is needed to promote SG formation.
If not stated otherwise, stress was induced by 2 h 2-DG treatment and scale bar indicates 2 µm. Values represent percentage of foci formation or co-localization and are shown as mean ± S.D. If not stated otherwise, >300 cells were analyzed for each biologically independent experiment. a Bioinformatic analysis of Lsm7’s phase separation potential. IDR; intrinsically disordered region prediction, IUPred2 (red, >0.5 regarded as IDR), ANCHOR2 (blue, >0.5 regarded as disordered binding region). PLD; prion-like domains prediction (PLAAC, green, <0 predicted as prion-like; PAPA, purple, <−0.02 or below the dashed line predicted as prion-like). PS propensity; LLPS propensity prediction (>0 treated as positive propensity). Hydro; hydrophobicity prediction (Kyte & Doolittle, >0 treated as hydrophobic). Lsm7 domains of interest are highlighted with dashed lines (IDR, amino acids 39-53 and 90-103). b Lsm7-GFP mutants exhibited significantly decreased Lsm7 foci (top) and SG formation (bottom) as compared to the WT (BY4741). Seven (BY4741, lsm7Δ39-53) and six (lsm7ΔIDR, lsm7Δ90-103) biologically independent experiments were examined and >200 cells were analyzed for each (two-way ANOVA followed by Dunnett’s multiple comparisons test, with individual variances computed for each comparison). ****p < 0.0001, ***p = 0.0001. c Construction of LSM7-eGFP-spacer strain. d Lsm7 foci (top) and SG formation (bottom) are significantly reduced in the spacer-tagged strain. Six biologically independent experiments were examined (unpaired two-tailed t-test). ****p < 0.0001, **p = 0.0014. e Lsm7 foci appear much earlier than SGs. Four biologically independent experiments were examined. f 3D-SIM shows the development process and co-localization structures of the Lsm7 foci and SGs. Scale bar indicates 250 nm. Values represent diameters (nm) of SGs (top) and Lsm7 foci (bottom) (mean ± S.D). Representative data for four biologically independent experiments (one-way ANOVA followed by Dunnett’s test, compared to the corresponding signal of the time-point 30 min). *p = 0.047, **p = 0.0089, ***p = 0.00021. g 3D-surface construction of Lsm7-eGFP and Pab1-RFP foci signals. Scale bar indicates 100 nm. h Lsm7 foci harbor RNA. White arrows indicate co-localizing RNA and mRuby2 foci. Representative images from three biologically independent experiments. Source data are provided as a Source Data file.

