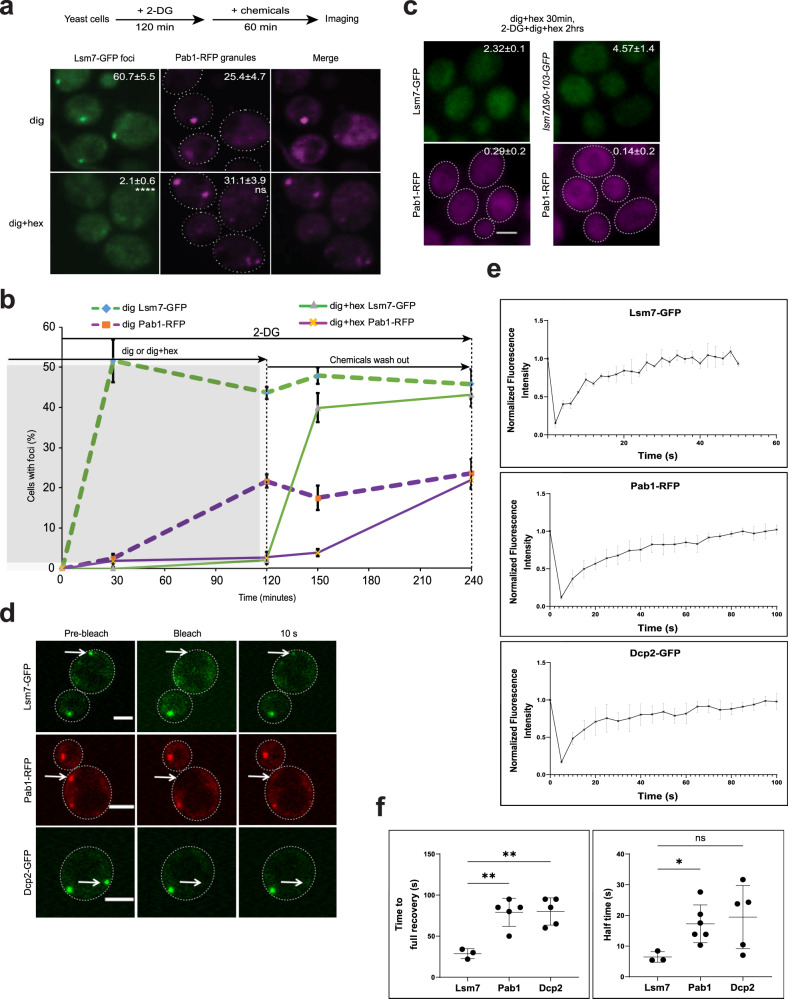
Fig. 7. Lsm7 phase-separated condensates are dynamic and promote SG formation under 2-DG treatment.
Scale bar indicates 2 µm and values represent mean ± S.D. a 1,6-hexanediol could dissolve the Lsm7 foci formed under 2-DG treatment but did not seemingly affect the Pab1 granules (dig, digitonin; dig+hex, digitonin plus 1,6-hexanediol). Values represent percentage of cells with Lsm7 foci or SGs. Four biologically independent experiments were examined and >200 cells were analyzed for each (unpaired two-tailed t-test). ****p < 0.0001, ns = 0.1063. b 1,6-hexanediol could block 2-DG-induced Lsm7 foci or Pab1 granule formation. (left, gray area). Once 1,6-hexanediol was washed out from the media, Lsm7 foci formed promptly while Pab1 granules formed afterward (right). Four biologically independent experiments were examined and >200 cells were analyzed for each. c Dissolved foci phenotype of Pab1-RFP and Lsm7-GFP pre-treated with 1,6-hexanediol and digitonin (30 min) followed by addition of 2-DG for 2 h. The SG and Lsm7 foci formation was hampered in the WT Lsm7-GFP (left) strain as well as the lsm7∆90-103-GFP mutant (right). Three biologically independent experiments were examined and >200 cells were analyzed per clone. Values represent percentage of cells with Lsm7 foci or SGs. d Images depicting in vivo FRAP analysis on Lsm7-GFP, Pab1-RFP, and Dcp2-GFP foci after 2 h 2-DG treatment. Images display foci before, immediately after and 10 s after photobleaching. Representative images from three (Lsm7), six (Pab1), and five (Dcp2) independent experiments. e FRAP recovery curves for Lsm7-GFP, Pab1-RFP, and Dcp2-GFP foci after 2 h 2-DG stress. Since the recovery of Lsm7 foci was quick, the x-axis (time, seconds) is shorter than for Pab1-RFP and Dcp2-GFP. Three (Lsm7), six (Pab1), and five (Dcp2) independent experiments. f FRAP results depicting time (s) to full recovery after bleaching (left) and calculated half-time rate (right). Three (Lsm7), six (Pab1), and five (Dcp2) independent experiments (one-way ANOVA followed by Dunnett’s T3 multiple comparisons test, with individual variances computed for each comparison). Left to right: **p = 0.0035, **p = 0.0029, *p = 0.0134, ns = 0.0912. Source data are provided as a Source Data file.

