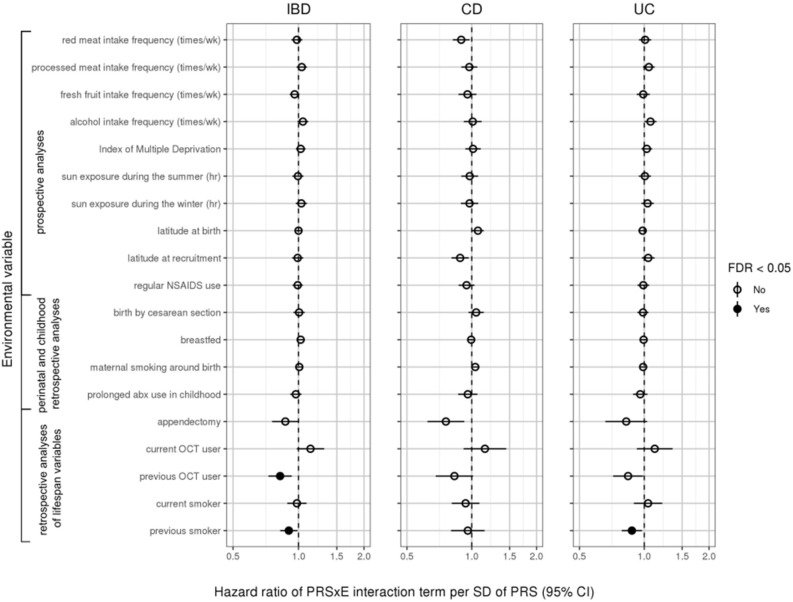
Figure 5.
Forest plot of hazard ratios (dots) and 95% confidence intervals (lines) for PRSxE interactions obtained from Cox regressions. Hazard ratios were adjusted for other covariates, including polygenic risk. Statistically significant results (FDR < 0.05) represented by filled circles. x-axis truncated at 2. For continuous variables, hazard ratios are given per standard deviation of the variable per standard deviation of PRS. For binary variables, hazard ratios are given per standard deviation of PRS. Results for 24-h dietary variables are shown in Supplemental Fig. 4. Results for hormone replacement therapy not displayed because they did not meet the proportional hazards assumption.

