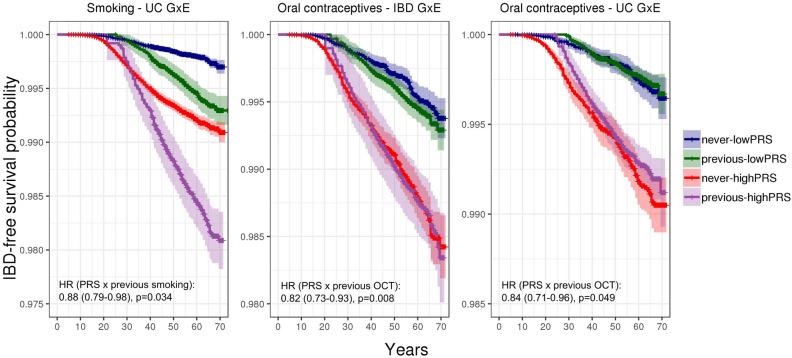
Figure 7.
Kaplan–Meier curves for variables with statistically significant PRSxE interactions (FDR < 0.05 in Cox regressions conditional on polygenic risk and other covariates), with IBD diagnosis as the event. “Never” indicates participants never exposed to variable, “previous” refers to participants who started and subsequently stopped exposure, “lowPRS” refers to polygenic risk below median, “highPRS” refers to polygenic risk above median. Curves of current users are omitted to emphasize the interactive effect. OCT = oral contraceptive therapy.

