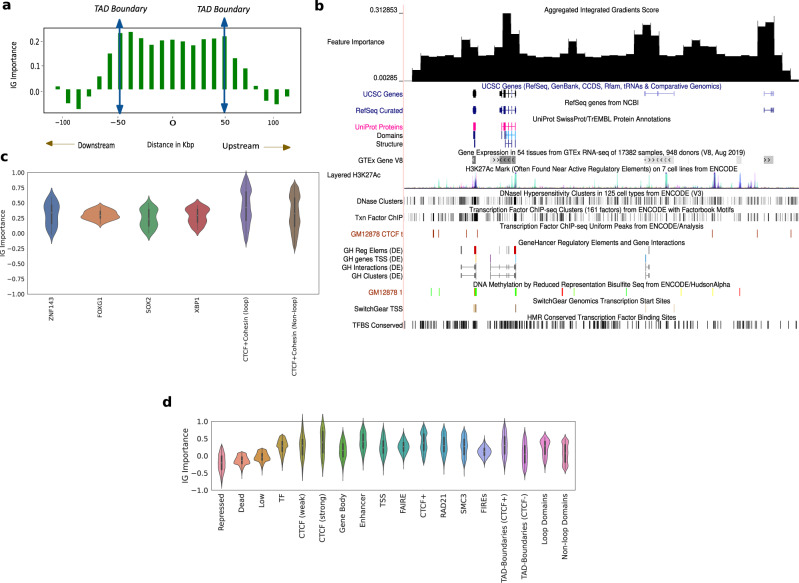
Fig. 6. Hi-C-LSTM representations identify genomic elements involved in conformation through integrated gradients (IG) feature importance analysis.
a The IG feature importance averaged across different TADs of varying sizes. The vertical axis indicates the average IG importance at each position and the horizontal axis refers to relative distance between positions in kbp, upstream/downstream of the TADs. b The IG feature importance for a selected genomic locus (chr21 28–29.2 Mbp) along with genes, regulatory elements, GC percentage, CTCF signal, and conserved TFBS among others in the UCSC genome browser. We see that the feature importance scores peak at known regulatory elements, higher GC percentage, and CTCF peaks. c Violin plots of aggregated feature attribution scores for top ranked transcription factor binding sites (TFBS). The x-axis shows the labels/elements and the y-axis displays the z normalized feature importance scores from Integrated Gradients. Both at loop and non-loop regions, the scores shown are aggregated only at shared sites. d Violin plots of aggregated feature attribution scores for selected elements. The x-axis shows the labels/elements and the y-axis displays the z normalized feature importance scores from Integrated Gradients. The scores for CTCF and Cohesin subunits are aggregated genome wide. In c, d, Violin plots present summary statistics where the white dot is the median, thick gray bar is the inter-quartile range, and thin gray line is the rest of the distribution. Kernel density estimation is shown on either side of the line. Sample size for the genomic elements are calculated genome wide by considering all observations of elements according to element specific data.

