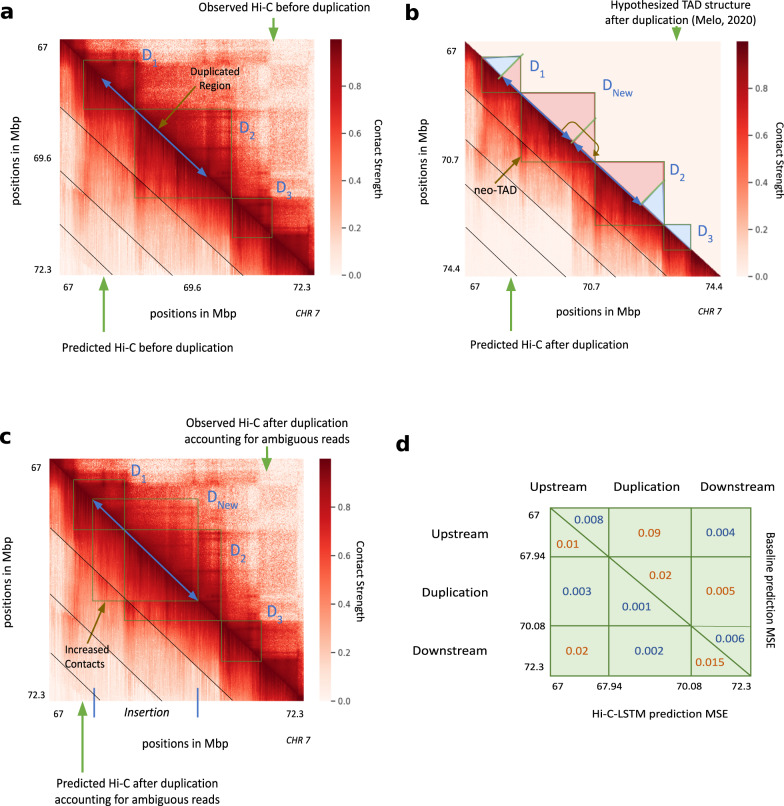
Fig. 7. In-silico duplication of a 2.1 Mbp region on Chromosome 17.
In all subplots, upper and lower triangles denote observed and predicted Hi-C contact probabilities respectively, and diagonal black lines denote Hi-C-LSTM frame boundaries. a Observed and predicted Hi-C before duplication. D1, D2 and D3 indicate the three pre-duplication topological domains. b Predicted Hi-C after duplication on a simulated reference genome that includes both copies. Lower triangle indicates Hi-C-LSTM predicted contacts. The true Hi-C contact matrix on this reference genome is not observable because the read mapper cannot disambiguate between the two copies. The upper triangle depicts the post-duplication topological domain structure hypothesized by Melo et al, which includes a novel topological domain DNew. c Observed and predicted Hi-C on the observed pre-duplication reference genome. Upper triangle shows observed post-duplication Hi-C data assayed by Melo et al. Lower triangle shows Hi-C-LSTM predictions, mapped to the pre-duplication reference by summing the contacts for the two copies (see the section “Results”). d Average mean-squared error (MSE) in predicting the observed data by (lower triangle) Hi-C-LSTM, and (upper triangle) a simple baseline (see the section “Results”) at the upstream, duplicated, and downstream regions.

