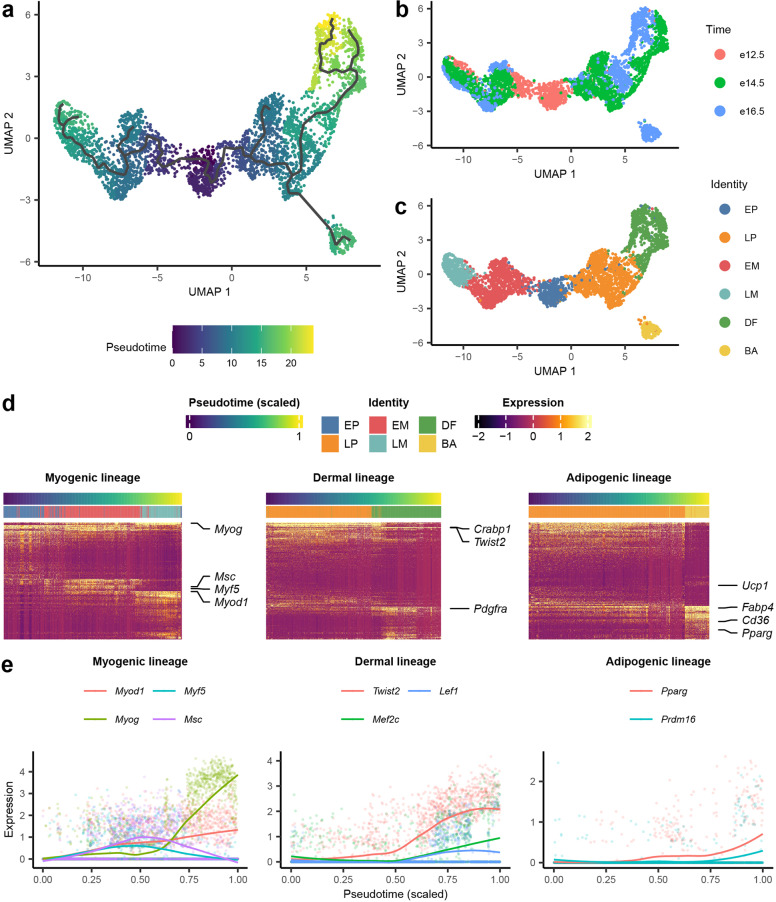
Fig. 2. Pseudotime trajectory and its correlation with gene expression in lineages.
a UMAP of YFP+ cells (excluding neurons and pericytes) labeled by pseudotime value with trajectory from Monocle 3. b UMAP of YFP+ cells (excluding neurons and pericyte) labeled by embryo harvest time. c UMAP of YFP+ cells (excluding neurons and pericyte) labeled by identity. d Z-score heatmap of gene expression in different branches, where rows are genes and columns are cells ranked by pseudotime value. Genes were first fit with generalized additive model (GAM) with ranked pseudotime as independent variable. Genes with the most significant time-dependent model fit (lowest P-value) were extracted and clustered by hierarchical clustering. Cells were ordered according to scaled pseudotime value from 0 to 1. Left, Myogenic lineage from EP to EM and LM; Middle, Dermal lineage from LP to BA; Right, Brown adipogenic lineage from LP to DF. e Scatter plot of temporally expressed genes obtained from GAM to scaled pseudotime. LOESS line of expression level was shown for each gene.

