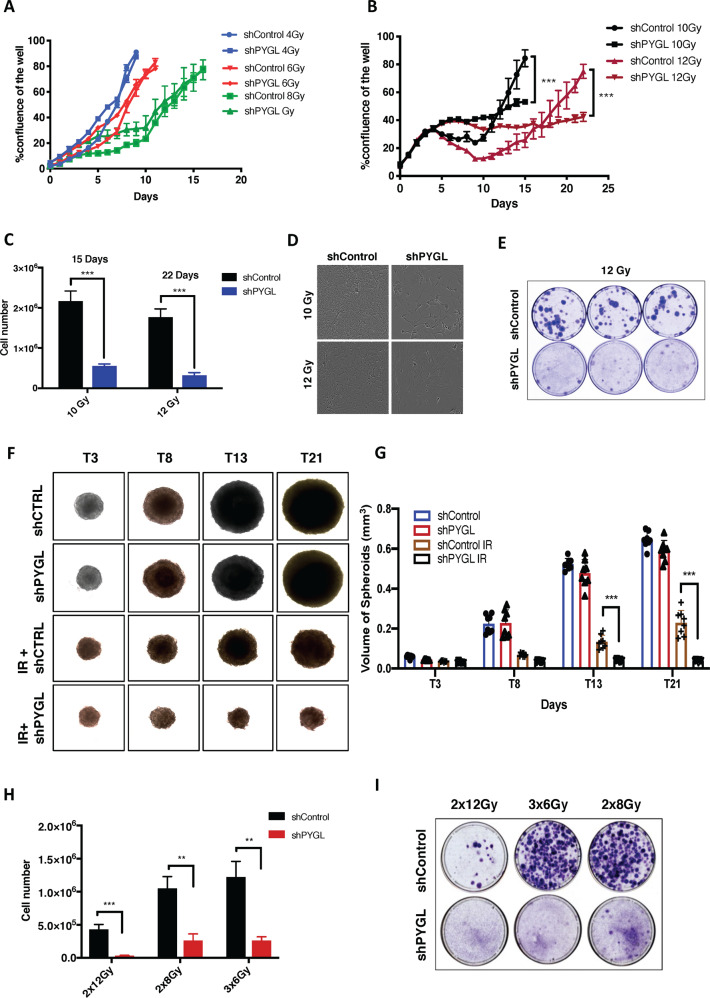
Fig. 2. Inhibition of glycogen phosphorylase liver isoform (PYGL) sensitises glioblastoma (GBM) cells to ionising radiation (IR).
A, B Cell proliferation in response to different doses of IR (n = 3, error bars are ± SD, ***p < 0.001). C, D Cell numbers and phase contrast images in response to 10 and 12 Gy IR in control (shControl) and PYGL knockdown (shPYGL) U87MG cells (n = 3, error bars are ±SD, ***p < 0.001, p-values calculated by unpaired t-test). E Coomassie blue staining was conducted 21 days after a single IR dose of 12 Gy in shControl and shPYGL U87MG cells. (n = 3). F, G Representative spheroid images F and quantification of spheroid volume (G) on day 3 (T3), day 8 (T8), day 13 (T13) and day 21 (T21) of shControl and shPYGL U87MG cells with or without IR on day 0 (n = 3, error bars are ±SD, ***p < 0.001, p values were calculated by Two Way ANOVA - Tuckey post-hoc). H, I. Cell numbers and Coomassie blue staining 21 days after different fractionated schedules of IR (2x12Gy, 3x6Gy, 2x8Gy) in shControl and shPYGL U87MG cells (n = 3, error bars are ±SD, **p < 0.01, ***p < 0.001, p values were calculated by unpaired t-test).

