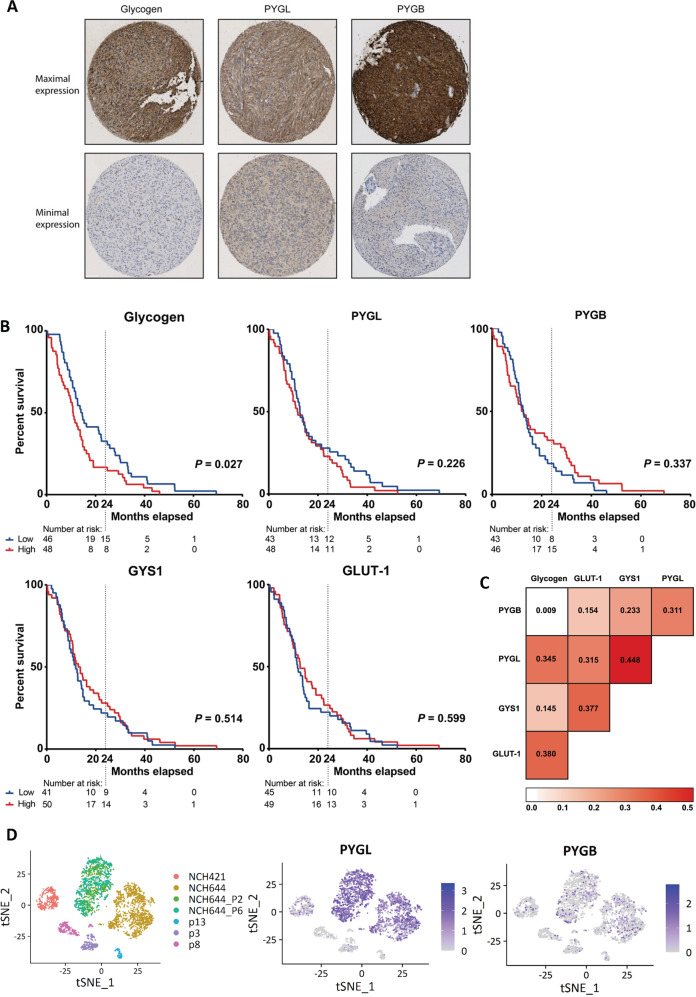
Fig. 6. Gene and protein expression of glycogen and glycogen related enzymes in glioblastoma (GBM) patient tumours.
A Maximal and minimal protein expression of glycogen, glycogen phosphorylase liver isoform (PYGL) and glycogen phosphorylase brain isoform (PYGB) observed in the tissue cores on the stained tissue microarray. B Kaplan-Meier curves plotted based on the mean protein expression score of three or four GBM tissue cores per patient younger than 70 years of age at date of surgery. Low or high protein expression of glycogen, PYGL and PYGB was determined based on the median score per patient in the complete cohort. C Heatmap showing Spearman’s correlations between protein expression scores of glycogen, glucose transporter 1 (GLUT-1), glycogen synthase 1(GYS1), PYGL and PYGB per glioblastoma tissue core. D t-Distributed Stochastic Neighbour Embedding (t-SNE) [67] plots showing the expression of PYGL and PYGB in FACS-sorted tumor cells of 3 GBM PDXs (P3, P8, P13) and 2 patient derived GBM cultures (NCH644, NCH421k) and subpopulations of NCH644 P2 (CD133 + CD44-A2B5 + CD15 + ) and P6 (CD133 + CD44 + A2B5 + CD15 + ). One sample per tumour is available.

