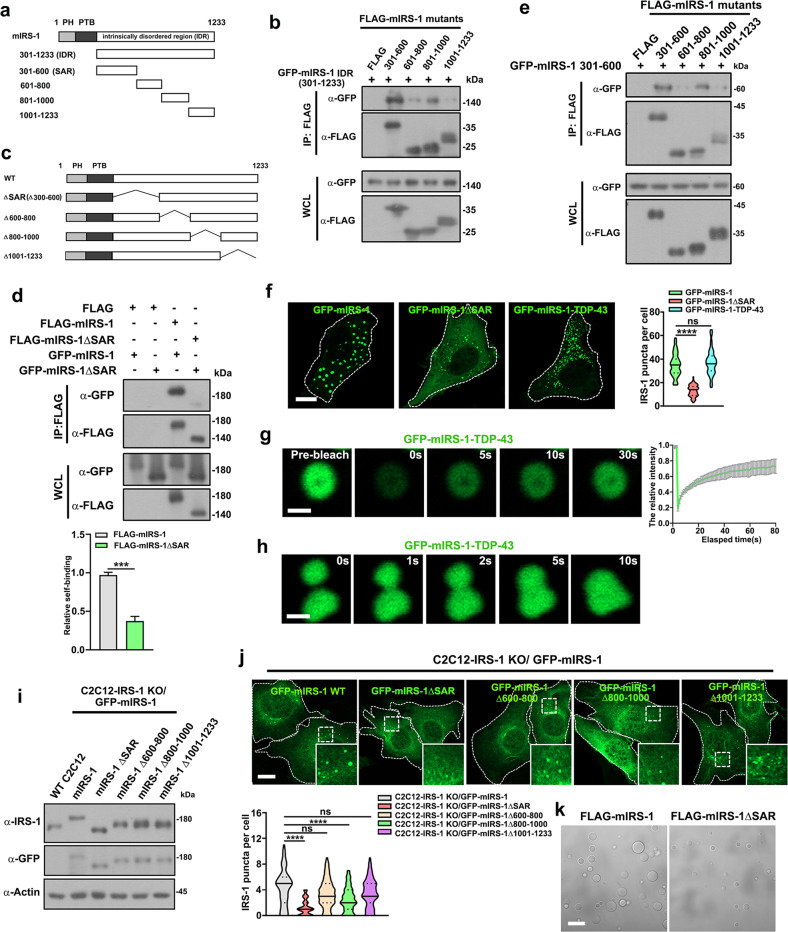
Fig. 3. Phase separation of IRS-1 relies on self-association.
a Schematic diagram of IDR of mIRS-1 and its truncation mutants. b FLAG-tagged mIRS-1 mutant constructs as shown in (a) were co-transfected with GFP-mIRS-1 IDR (301–1233) into 293 T cells for immunoprecipitation analysis. c Schematic diagram of mIRS-1 and its deletion mutants. d FLAG-tagged and GFP-tagged mIRS-1 or mIRS-1 ΔSAR mutants were co-transfected into 293 T cells for immunoprecipitation analysis. Data in the bar graphs represent the means ± SEM values of the ratios of densities for three independent experiments. ***p < 0.001. e FLAG-tagged mIRS-1 mutant constructs were co-transfected with GFP-mIRS-1 301–600 into 293 T cells for immunoprecipitation analysis. f Representative confocal images of GFP-tagged mIRS-1, mIRS-1 ΔSAR mutant, and mIRS-1-TDP-43 mutant in C2C12 cells. Quantification results of GFP-mIRS-1 and mutant puncta are shown as violin plots (n = 80). ****p < 0.0001. ns: not significant. g Confocal images and quantification of GFP-mIRS-1-TDP-43 mutant fluorescence recovery after photobleaching. Scale bar, 1 µm. h Time-lapse imaging showing fusion of two GFP-mIRS-1-TDP-43 droplets in cells. Scale bar, 1 µm. i Immunoblot analysis of the indicated proteins in C2C12-IRS-1 KO cell lines stably expressing GFP-mIRS-1 (mIRS-1 WT, mIRS-1 ΔSAR, mIRS-1 Δ600–800, mIRS-1 Δ800–1000, and mIRS-1 Δ1001–1233). j Confocal images of GFP-tagged mIRS-1 wildtype and mutants in C2C12 cell lines as indicated in (i). Scale bar, 10 µm. Quantification results of GFP-mIRS-1 or mutant puncta are shown as violin plots. ****p < 0.0001. ns not significant. k DIC images of FLAG-mIRS-1 and mIRS-1 ΔSAR LLPS. The proteins (1 μM) were incubated with phase separation buffer at room temperature for 20 min. Scale bar, 20 µm.

