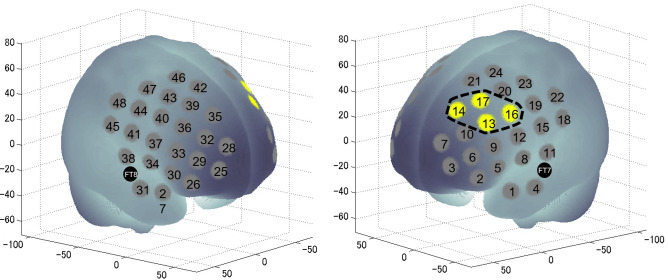
Figure 3.
The spatial profiles of functional near-infrared spectroscopy channels and region of interest segmentation used in the current study; they were introduced in previous studies46,50. Channel numbers and FT7 and FT8 in the international 10–20 electroencephalography standard positions are denoted above the corresponding locations. The channels enclosed by the black broken lines were defined as the l-DLPFC, and their data were integrated for further analyses.

