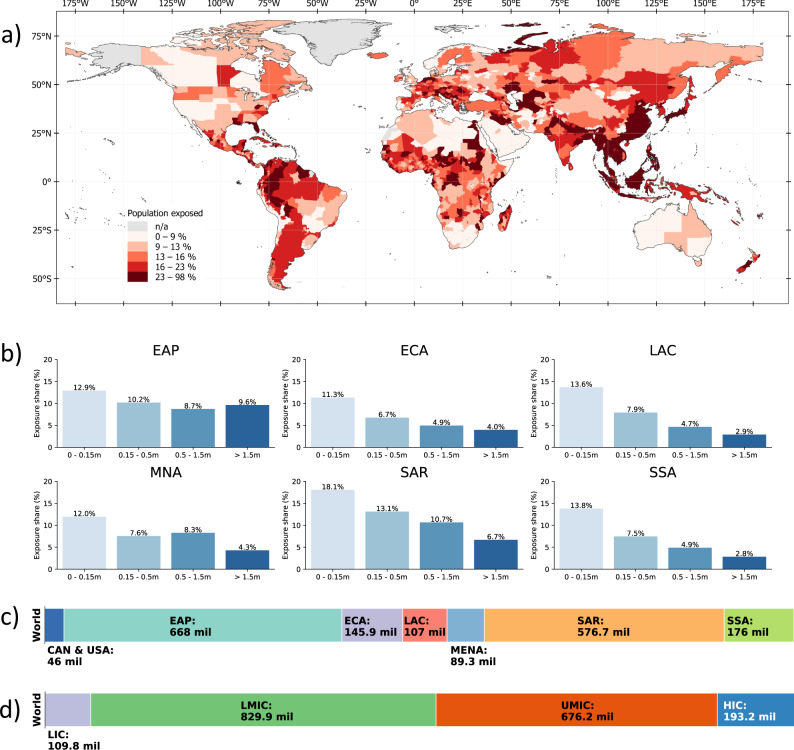
Fig. 2. Population exposed to floods.
a shows the percentage of population exposed to at least medium-level flood risk at the subnational level. b displays the percentage of population exposed to different levels of flood risk in each region. c, d show the total number of people exposed to at least medium-level flood risk based on geographical region and countries’ income classification, respectively. EAP East Asia and Pacific, ECA Europe and Central Asia (ECA), SAR South Asia region, SSA Sub-Saharan Africa, MNA Middle East and North Africa, LAC Latin America and the Caribbean, CAN & USA United States and Canada, HIC high-income countries, UMIC upper middle-income countries, LMIC lower-middle-income countries, LIC low-income countries.

