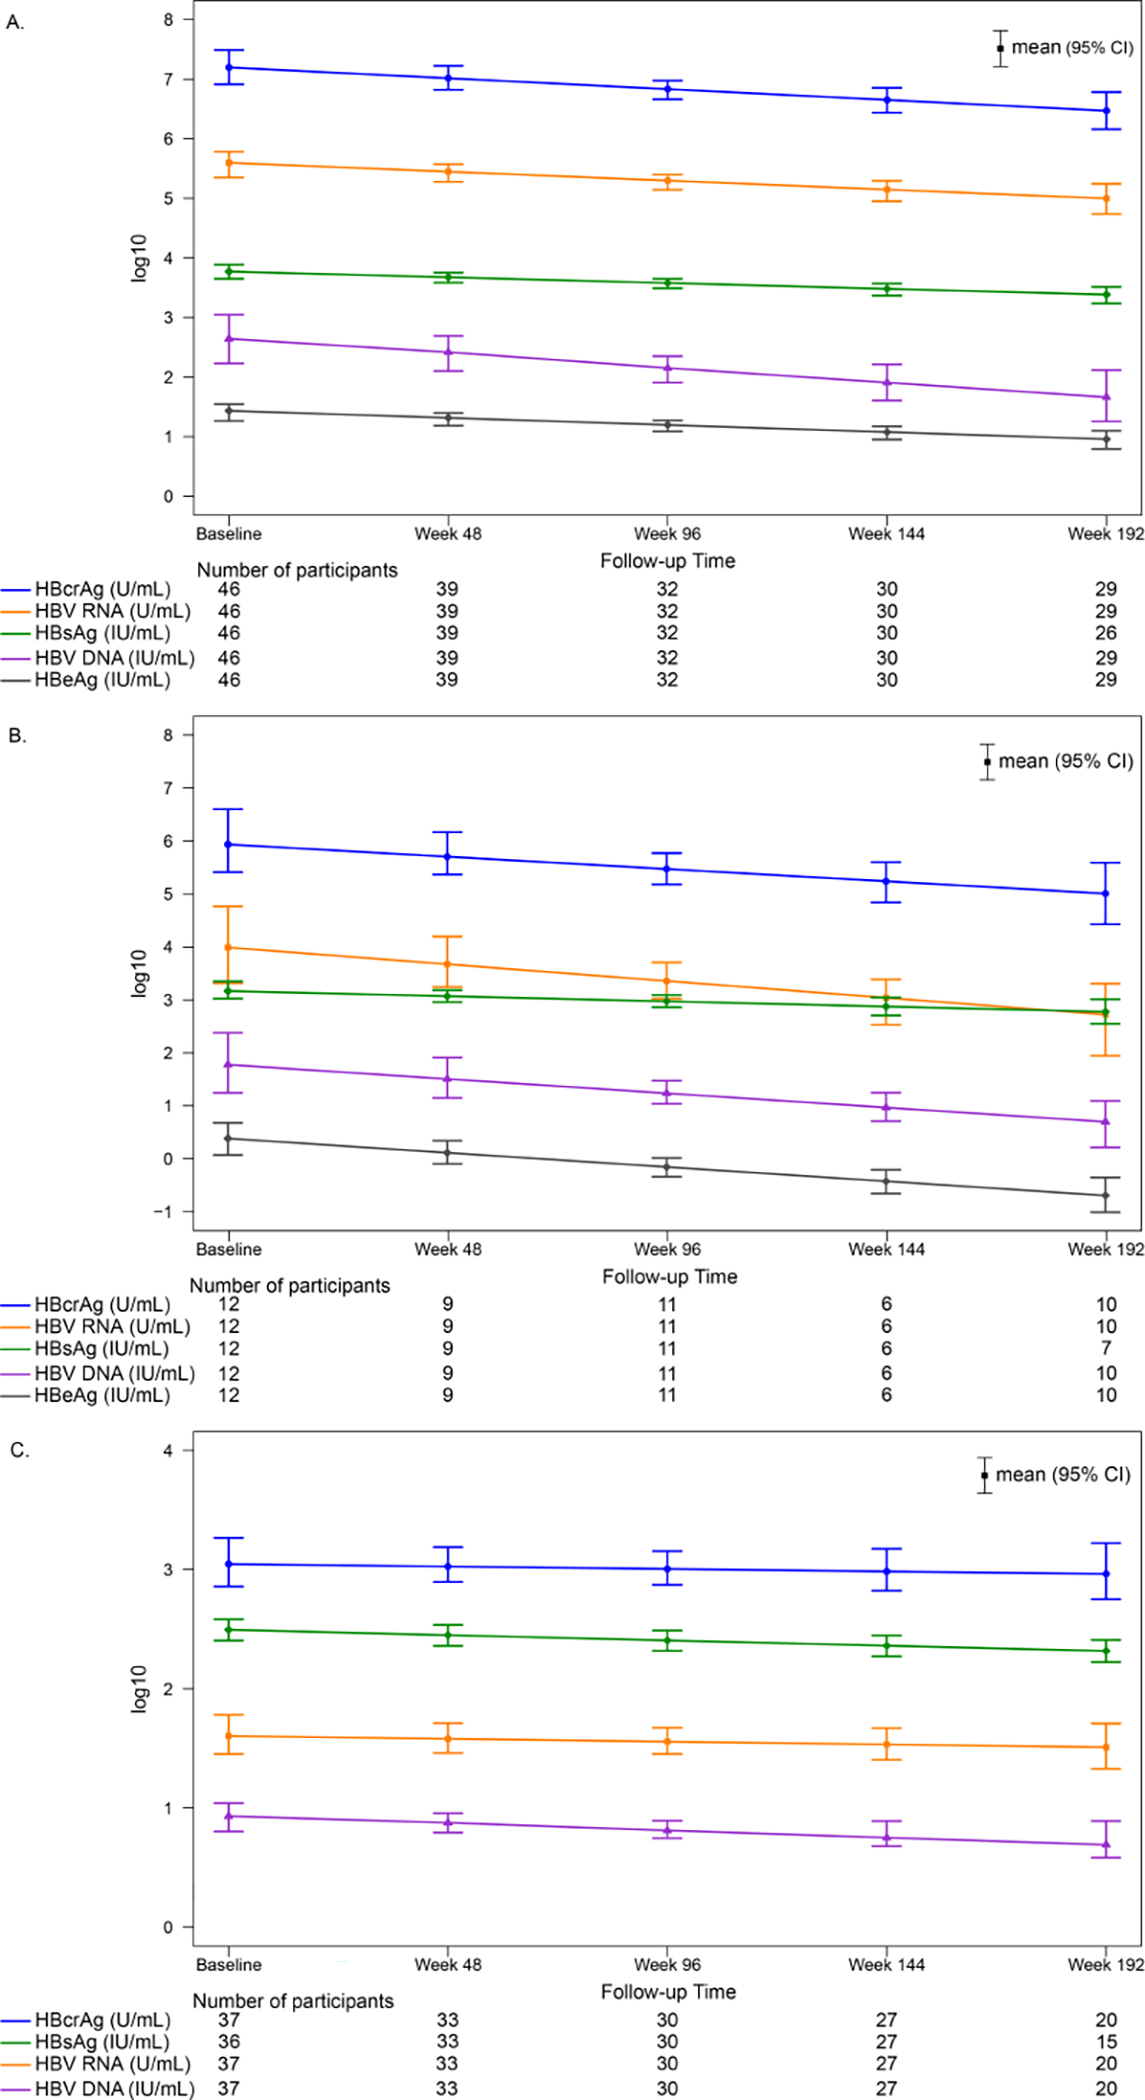
Figure 2.

Modeled means (95% CI) of HBV DNA, HBV RNA, HBcrAg, qHBeAg and qHBsAg by time point, stratified by HBeAg status throughout follow-up
A. HBeAg positive
B. HBeAg positive to negative during follow-up
C. HBeAg negative
There was a significant decrease in HBV DNA, HBV RNA, HBcrAg, qHBeAg and qHBsAg among HBeAg positive (panel A) and HBeAg positive to negative (panel B) participants (P for all<.05). Among HBeAg negative participants, there was a significant decrease over time in HBV DNA (P=.03) and qHBsAg (P<.001), but not HBV RNA (P=.49) or HBcrAg (P=.63).
