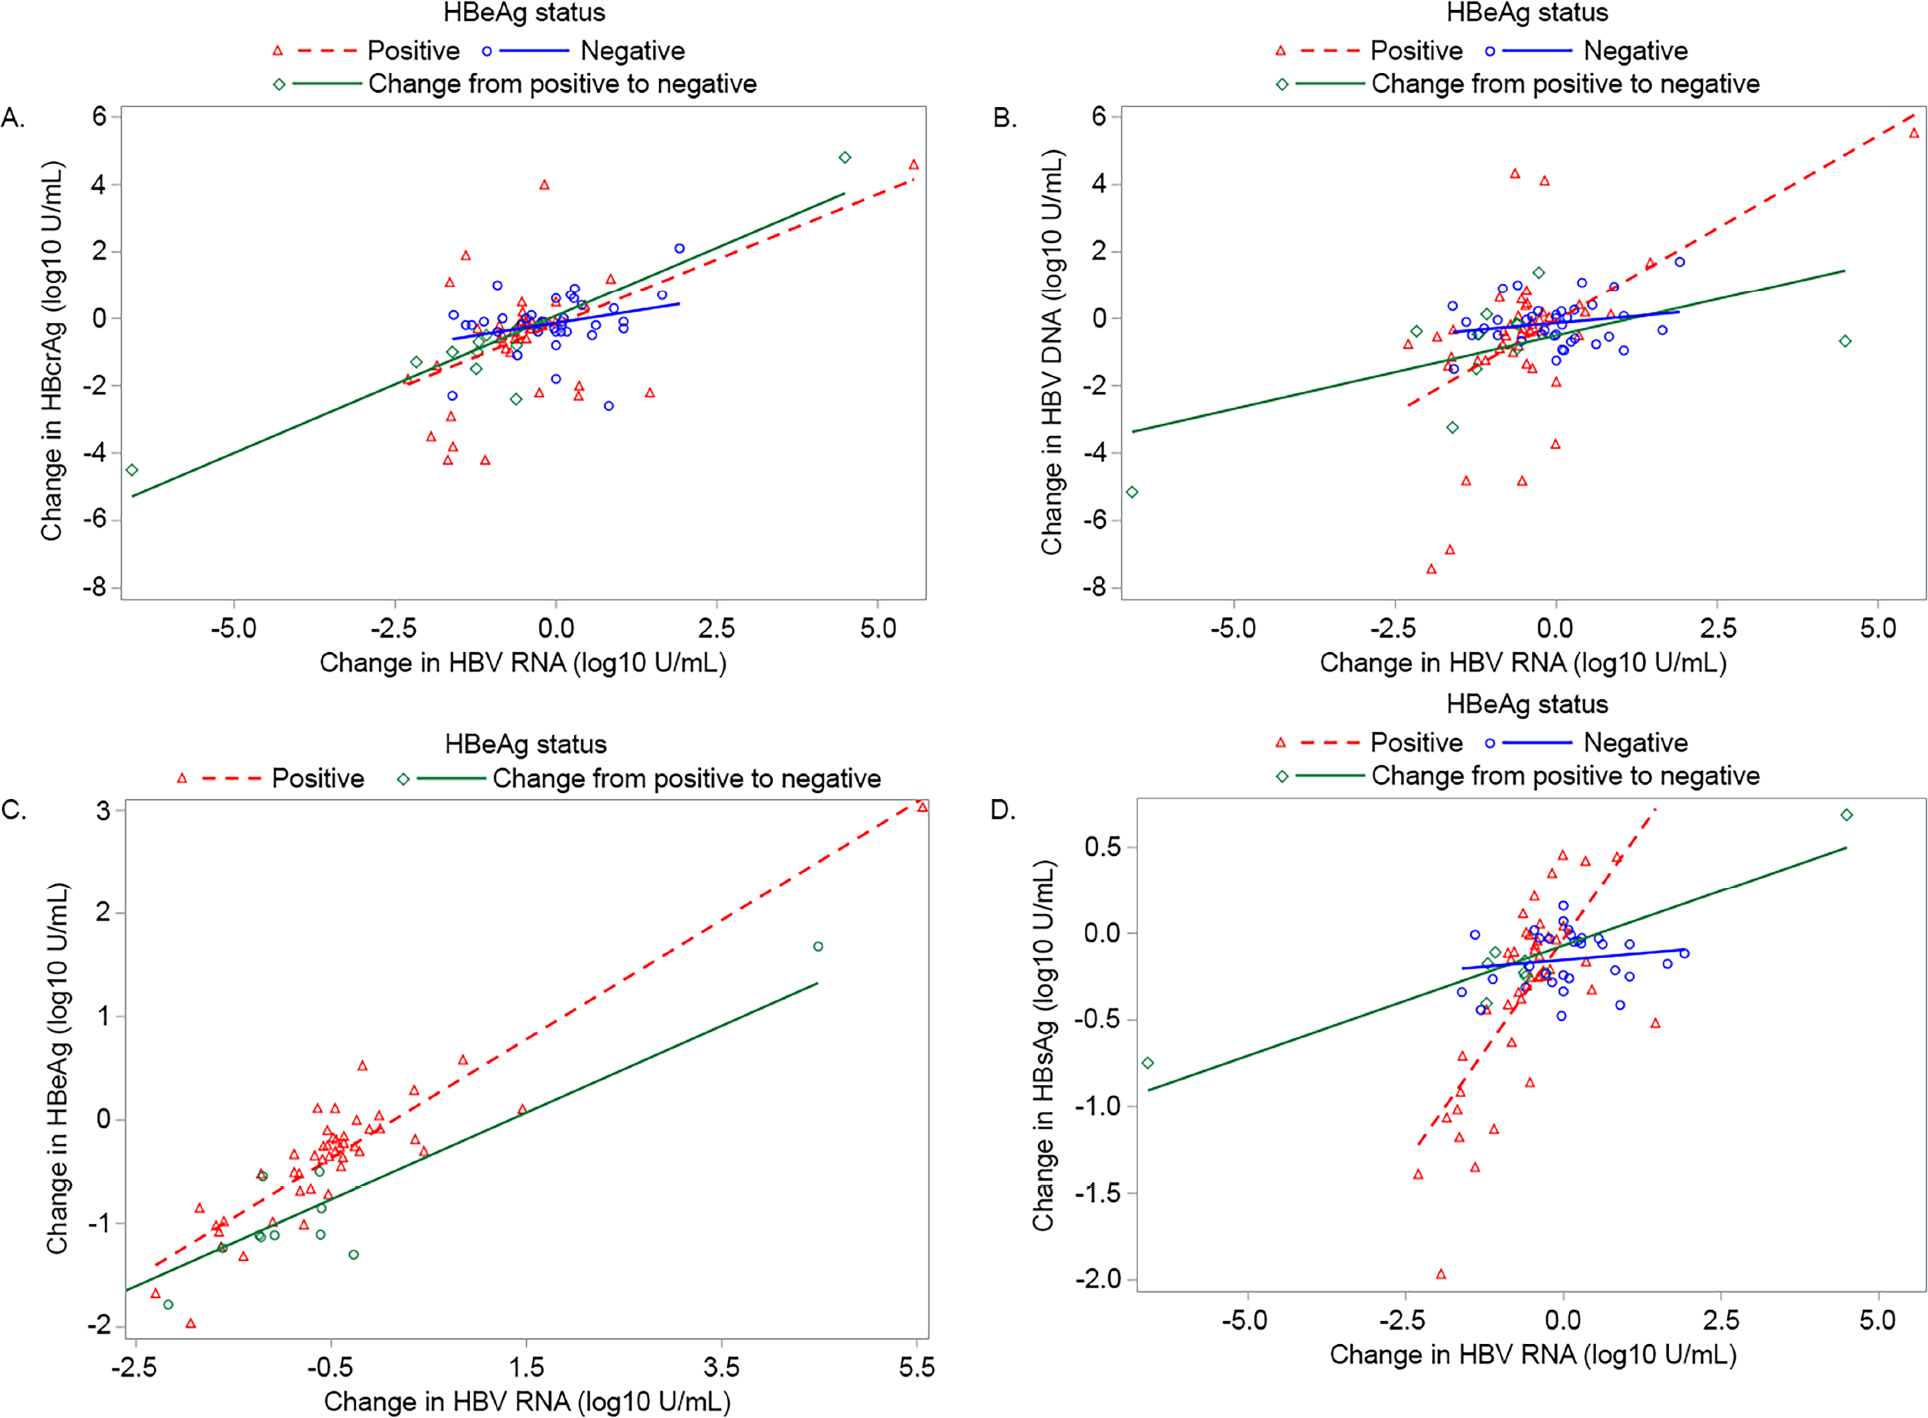
Figure 3.

Correlations between change (last follow-up value - baseline value) in HBV RNA with change in HBcrAg, HBV DNA, qHBeAg and qHBsAg, respectively, stratified by HBeAg status throughout follow-up
A. HBV RNA (log10 U/mL) and HBcrAg (log10 U/mL)
HBeAg positive: n=46, ρ=.42, p=.003
HBeAg positive to negative: n=12, ρ=.79, p=.002
HBeAg negative: n=37, ρ=.20, p=.23
B. HBV RNA (log10 U/mL) and DNA (log10 IU/mL)
HBeAg positive: n=46, ρ=.48, p<.001
HBeAg positive to negative: n=12, ρ=.52, p=.08
HBeAg negative: n=37, ρ=.05, p=0.77
C. HBV RNA (log10 U/mL) and qHBeAg (log10 IU/mL)
HBeAg positive: n=46, ρ=.83, p<.001
HBeAg positive to negative: n=12, ρ=.64, p=.02
D. HBV RNA (log10 U/mL) and qHBsAg (log10 IU/mL)
HBeAg positive: n=43, ρ=.68, p<.001
HBeAg positive to negative: n=9, ρ=.52, p=.15
HBeAg negative: n=31, ρ=.13, p=.49
