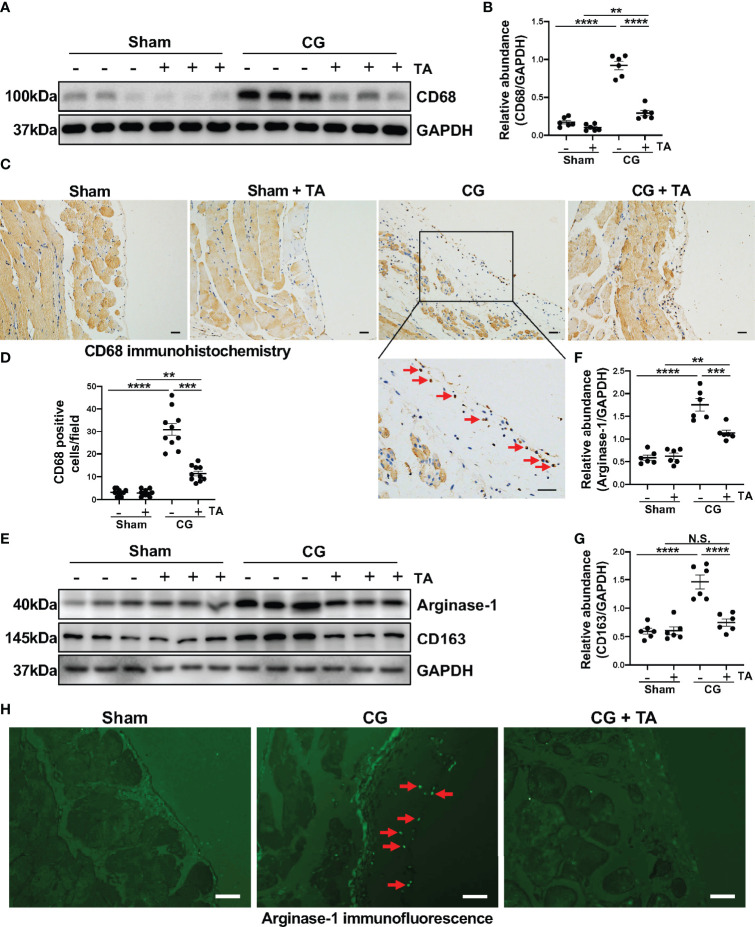
Figure 3.
Inhibition of HDAC6 prevents macrophage infiltration and alternatively activated macrophages (M2) polarization in CG-induced mouse model. (A) Western blot analysis showed the levels of CD68 and GAPDH in peritoneum from different groups of mice. (B) Expression levels of CD68 in different groups were quantified by densitometry and normalized with GAPDH. (C) Representative micrographs of immunohistochemical staining of CD68 on peritoneum from different groups of mice. Red arrows represent CD68 positive cells. (D) Quantization count of CD68-positive cells. (E) Western blot analysis showed the levels of Arginase-1, CD163, and GAPDH in peritoneum from different groups of mice. Expression levels of (F) Arginase-1 and (G) CD163 in different groups were quantified by densitometry and normalized with GAPDH. (H) Representative micrographs of immunofluorescence staining of Arginase-1 in peritoneum from different groups of mice. Red arrows represent Arginase-1 positive cells. Data were expressed as means ± SEM. **P<0.01, ***P<0.001, ****P<0.0001. All scale bars = 20 μm. NS: P≥0.05.

