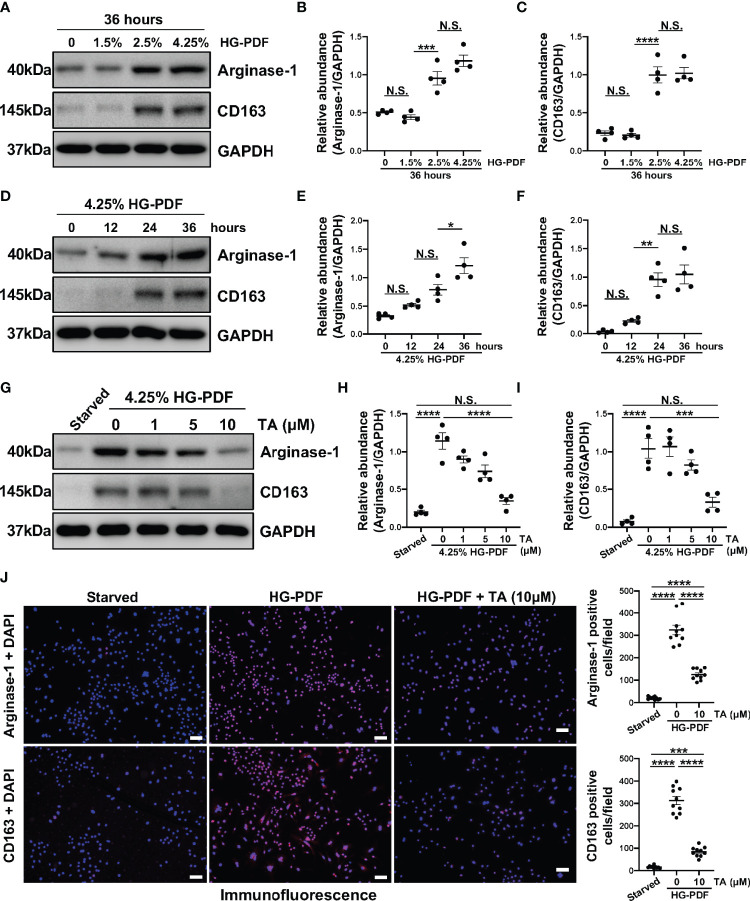
Figure 7.
TA inhibits M2 macrophage polarization in HG-PDF stimulated Raw264.7 cells. (A) Western blot analysis showed the levels of Arginase-1, CD163, and GAPDH in Raw264.7 cells treated with peritoneal dialysis fluid in different dextrose concentrations. Expression levels of (B) Arginase-1 and (C) CD163 in different groups were quantified by densitometry and normalized with GAPDH. (D) Western blot analysis showed the levels of Arginase-1, CD163, and GAPDH in Raw264.7 cells treated with 4.25% HG-PDF for different times. Expression levels of (E) Arginase-1 and (F) CD163 in different groups were quantified by densitometry and normalized with GAPDH. (G) Western blot analysis showed the levels of Arginase-1, CD163, and GAPDH in 4.25% HG-PDF treated Raw264.7 cells with different doses of TA. Expression levels of (H) Arginase-1 and (I) CD163 in different groups were quantified by densitometry and normalized with GAPDH. (J) Representative micrographs of immunofluorescence staining of Arginase-1 and CD163 in Raw264.7 cells with different treatments. Quantization count of Arginase-1 and CD163 positive cells was calculated. Data were expressed as means ± SEM. *P<0.05, **P<0.01, ***P<0.001, ****P<0.0001. All scale bars = 50 μm. NS: P≥0.05.

