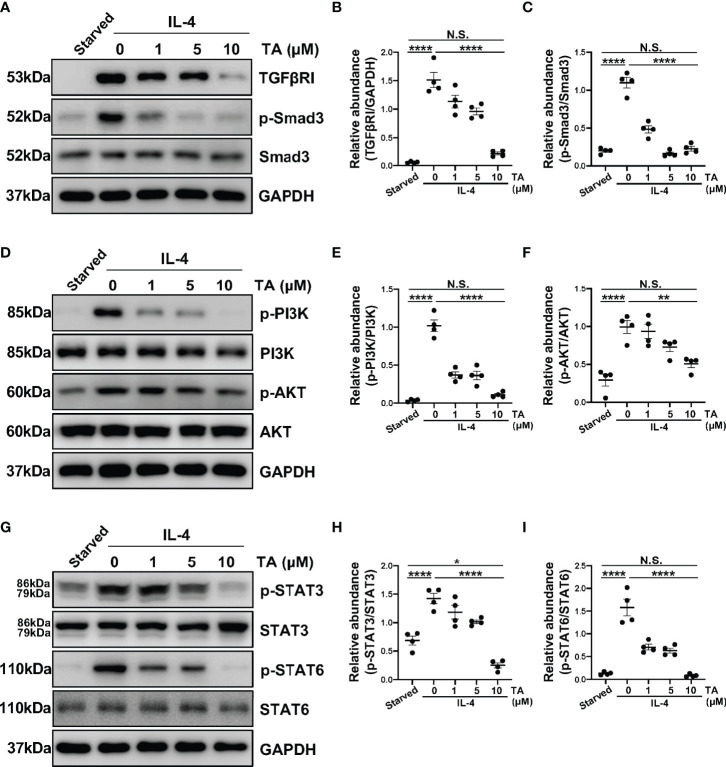
Figure 8.
TA inhibits M2 macrophage polarization via suppressing TGF-β1/Smad3, PI3K/AKT, STAT3 and STAT6 signaling in Raw264.7 cells stimulated by IL-4. (A) Western blot analysis showed the levels of TGFβRI, p-Smad3, Smad3, and GAPDH in IL-4-stimulated Raw264.7 cells treated with different doses of TA. Expression levels of (B) TGFβRI and (C) p-Smad3 in different groups were quantified by densitometry and normalized with GAPDH and Smad3 respectively. (D) Western blot analysis showed the levels of p-PI3K, PI3K, p-AKT, AKT and GAPDH in IL-4-stimulated Raw264.7 cells treated with different doses of TA. Expression levels of (E) p-PI3K and (F) p-AKT in different groups were quantified by densitometry and normalized with PI3K and AKT respectively. (G) Western blot analysis showed the levels of p-STAT3, STAT3, p-STAT6, STAT6, and GAPDH in IL-4-stimulated Raw264.7 cells treated with different doses of TA. Expression levels of (H) p-STAT3 and (I) p-STAT6 in different groups were quantified by densitometry and normalized with STAT3 and STAT6 respectively. Data were expressed as means ± SEM. *P<0.05, **P<0.01. NS: P≥0.05.

