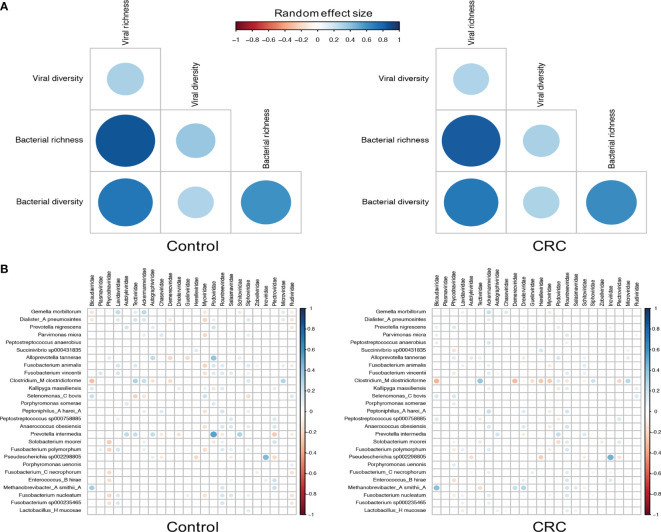
Figure 4.
Correlations between viral families and bacterial species. (A) Random effect size of Spearman’s correlation coefficients between the diversity and richness of bacteria and viruses in healthy controls and CRC subjects. Correlations with BH adjusted p-values <0.05 are displayed. (B) Random effect size of Spearman’s correlation coefficients between the abundance of all 24 viral families and that of 27 differentially abundant bacterial species. Correlations with BH adjusted p-values <0.05 are displayed. The size and color of circles indicate the extent of correlation.

