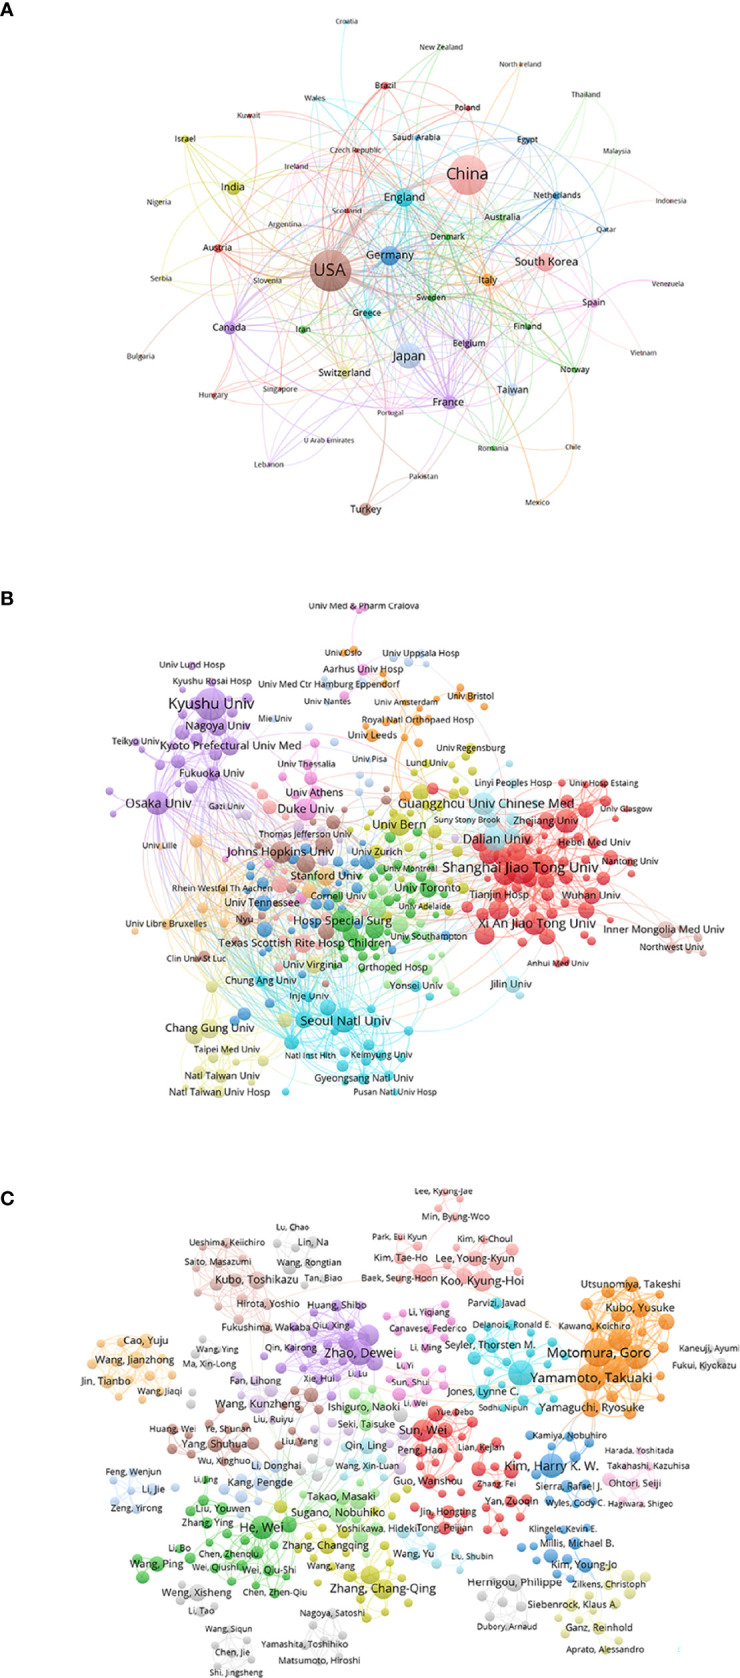
Figure 6.

Co-authorship analysis of global publications in ONFH in the last 30 years. (A) Network visualization of the 59 identified countries in ONFH. (B) Network visualization of the 405 identified institutions in ONFH. (C) Network visualization of the 629 identified authors in ONFH. In the visualized network, each item is represented by a circle. The size of the circle is determined by the number of publications of the item. The distance between two circles approximately indicates the relatedness of the items. Item color is determined by the cluster to which the item belongs.
