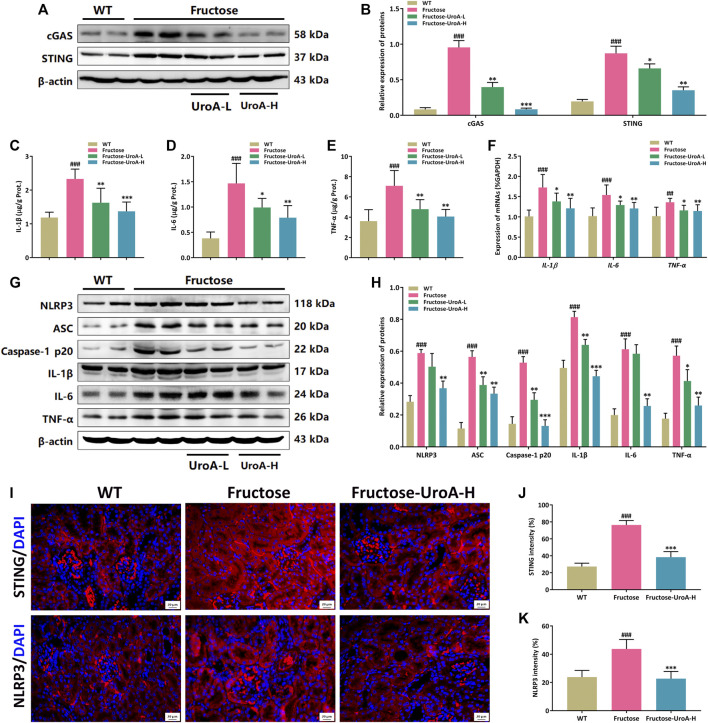
FIGURE 3.
Urolithin A (UroA) impairs STING-NLRP3 axis mediated renal inflammatory response in vivo. (A,B) Representative immunoblot images of cGAS and STING protein expression in kidneys (A) and densitometric analysis (B). (C–E) The level of IL-1β (C), IL-6 (D), and TNF-α (E) in kidney tissues were detected by commercial enzyme-linked immunosorbent assays (ELISA). (F) Histograms show RT-qPCR quantification of IL-1β, IL-6, and TNF-α mRNA expression in the kidney tissues from the wild-type (WT) or fructose-fed mice with intragastric administration of either vehicle or UroA, respectively. The representative immunoblots of NLRP3, ASC, Caspase-1 p20, IL-1β, IL-6, and TNF-α were shown in (G). (H) Histograms show the protein expression of NLRP3, ASC, Caspase-1 p20, IL-1β, IL-6, and TNF-α quantified through the western blotting optical analysis shown in (G). β-actin was used as an internal reference. (I) Representative images of immunofluorescence staining of STING and NLRP3 of kidney tissue sections. Original magnification: ×400; Scale bar: 20 μm. (J,K) Densitometric analysis of STING (J) and NLRP3 (K). Mean ± S.D., n = 8 for RT-qPCR quantification analysis and n = 5 for kidney protein expression analysis. ## p < 0.01, ### p < 0.001 versus the WT group; * p < 0.05, ** p < 0.01, *** p < 0.001 versus the fructose group. UroA-L and UroA-H represent intragastric administration of urolithin A at low (50 mg/kg/day) and high (100 mg/kg/day) doses, respectively. Prot.: protein.

