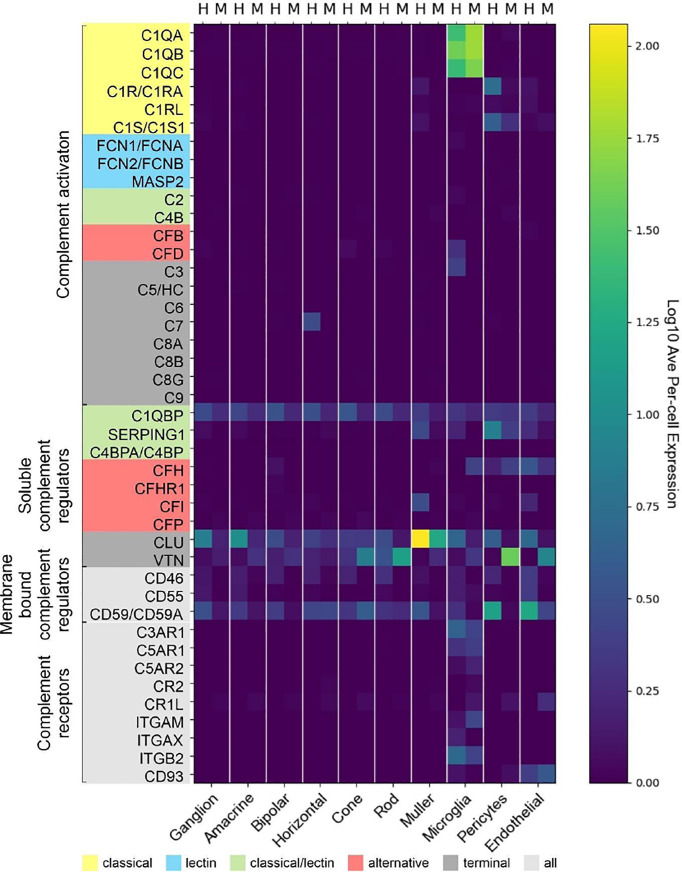
Figure 7.
Comparison of cell type-specific complement expression between peripheral human (H) and mouse (M) retina. Expression of complement components was determined by scRNA-seq. For cross-species comparison data from the present study on human retina was compared to recently published data from mouse retina (48). Expression is measured in units of FPKM (Fragments Per Kilobase of transcript per Million mapped reads) and color-coded on a logarithmic scale.

