Figure 5.
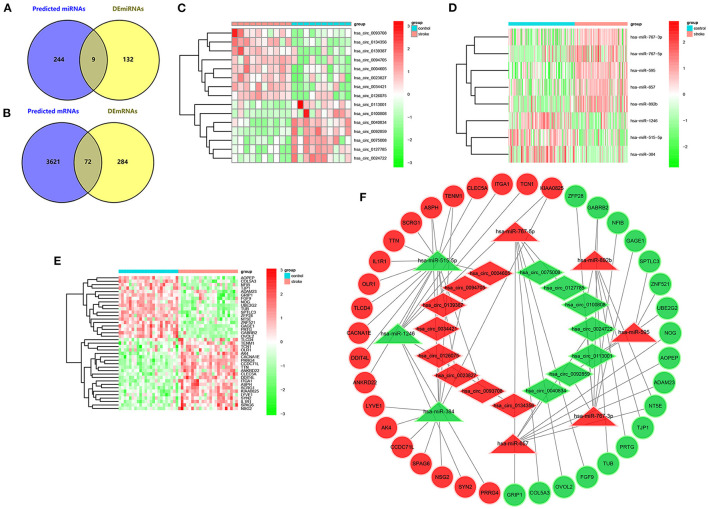
Constrcution of ceRNA network in IS. (A) Venn diagram of intersecting miRNAs of predicted miRNAs and DEmiRNAs in the GSE117064 dataset. (B) Venn diagram of intersecting mRNAs of predicted mRNAs and DEmRNAs in the GSE58294 dataset. (C) Heatmap of 15 DEcircRNAs involved in the ceRNA network in the GSE195442 dataset. (D) Heatmap of 8 DEmiRNAs involved in the ceRNA network in the GSE117064 dataset. (E) Heatmap of 39 DEmRNAs involved in the ceRNA network in the GSE58294 dataset. (F) circRNA-miRNA-mRNA network in IS. The diamond, triangle and circle indicate circRNA, miRNA and mRNA respectively. Red represents expression up-regulation and green represents expression down-regulation.

