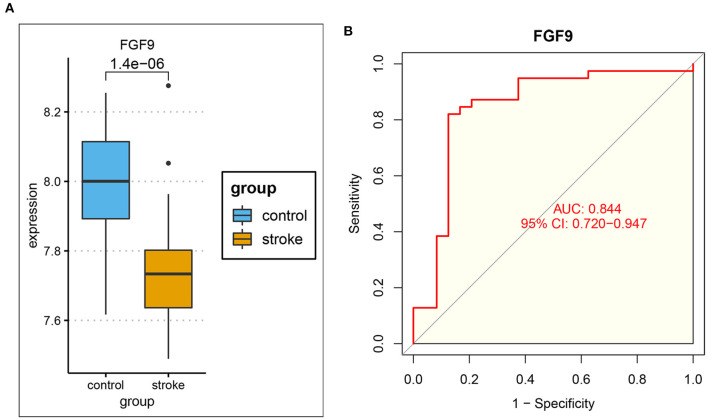
Figure 7.
Validation of FGF9 in the independent dataset GSE16561. (A) The expression of FGF9 was significantly down-regulated in IS patients compared to controls. (B) ROC curve analysis indicated that the expression of FGF9 was significantly associated with the diagnosis of IS (AUC = 0.844).

