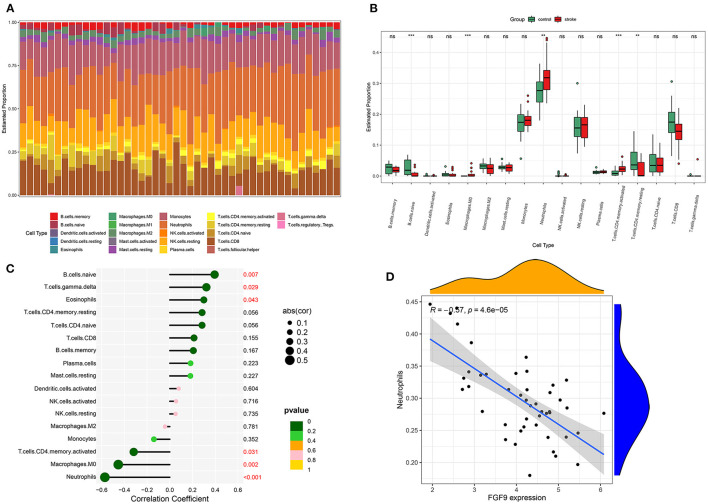
Figure 8.
Relative expression of immune cell subtypes. (A) Histogram of the proportion of each kind of immune cell. (B) Boxplot of relative expression of every immune cell subtypes between the controls and IS group. (C) Lollipop graph of the correlation between the FGF9 expression and each immune cell subtype. (D) The level of neutrophils was significantly negatively correlated with FGF9 expression.

