Figure 1.
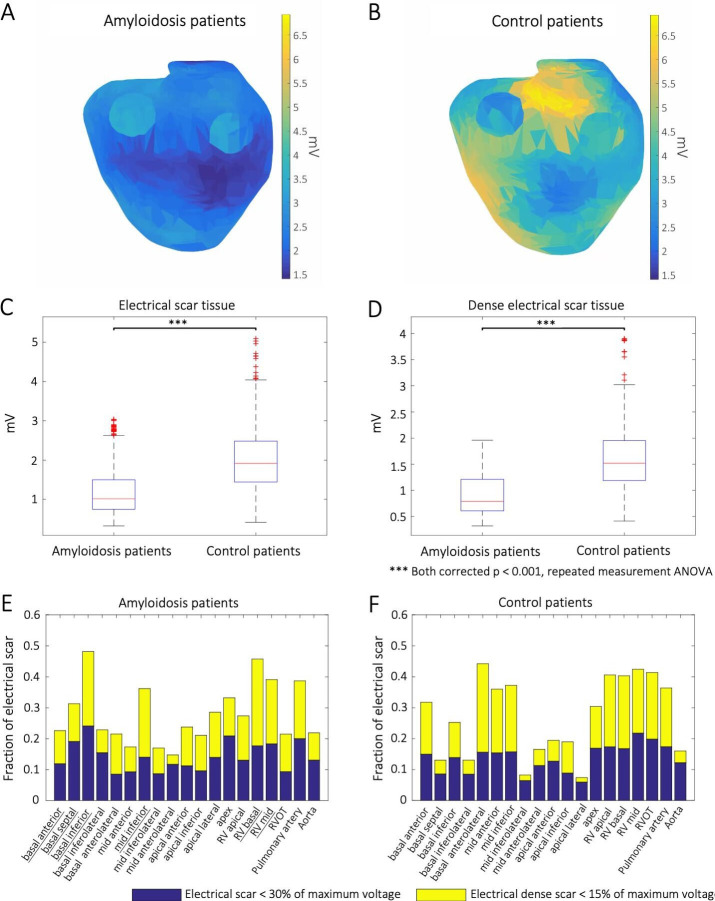
Mean ventricular voltage maps generated from electrogram magnitudes in CA (A) and controls (B) indicate an increased deposition of amyloid in the basal inferior regions of both ventricles and the remaining right ventricular segments in CA. Electrical scar tissue was defined as the maximum amplitude below the 30th percentile of the measured maximum voltage (C) and dense electrical scar tissue below the 15th percentile (D), with significantly lower mean voltage values in patients with CA compared with controls. The spatial distribution of electrical scar tissue between cardiac models of patients with CA (E) and controls (F) shows a greater extent of low voltage in almost all segments of patients with CA, with particularly affected areas in the basal, inferior and right ventricular segments. ANOVA, analysis of variance; CA, cardiac amyloidosis; RV, right ventricle; RVOT, right ventricular outflow tract.

