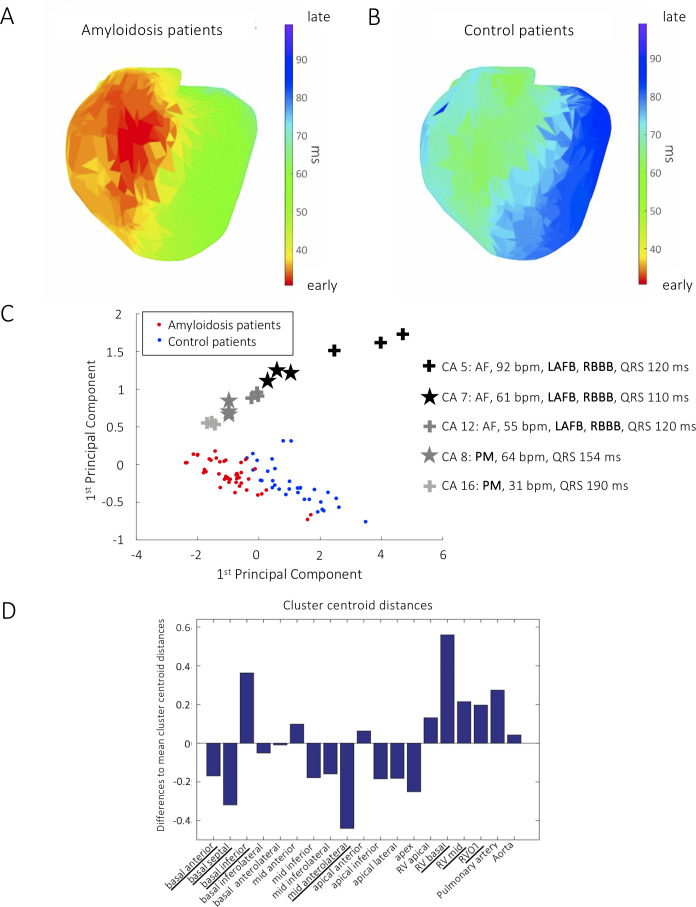
Figure 2.
Mean ventricular activation maps (normalised to heart rate) from CA (A) and controls (B) reveal an early epicardial breakthrough of the extraction on the right ventricle in CA. PCA of the activation maps from three consecutive ventricular beats of CA and controls identifies two distinct clusters and characteristic outliers had bifascicular blocks (left anterior fascicular block and right bundle branch block) or pacemakers (C). Cluster centroid distances of region-specific PCA with respect to activation patterns in CA and controls show the greatest cluster differences in the basal regions of both ventricles, the left mid-anterolateral segment of the left ventricle and the remaining right ventricular regions (D). AF, atrial fibrillation; bpm, beats per minute; CA, cardiac amyloidosis; LAFB, left anterior fascicular block; ms, miliseconds; PCA, principal component analysis; PM, pacemaker; RBBB, right bundle branch block; RV, right ventricle; RVOT, right ventricular outflow tract.

