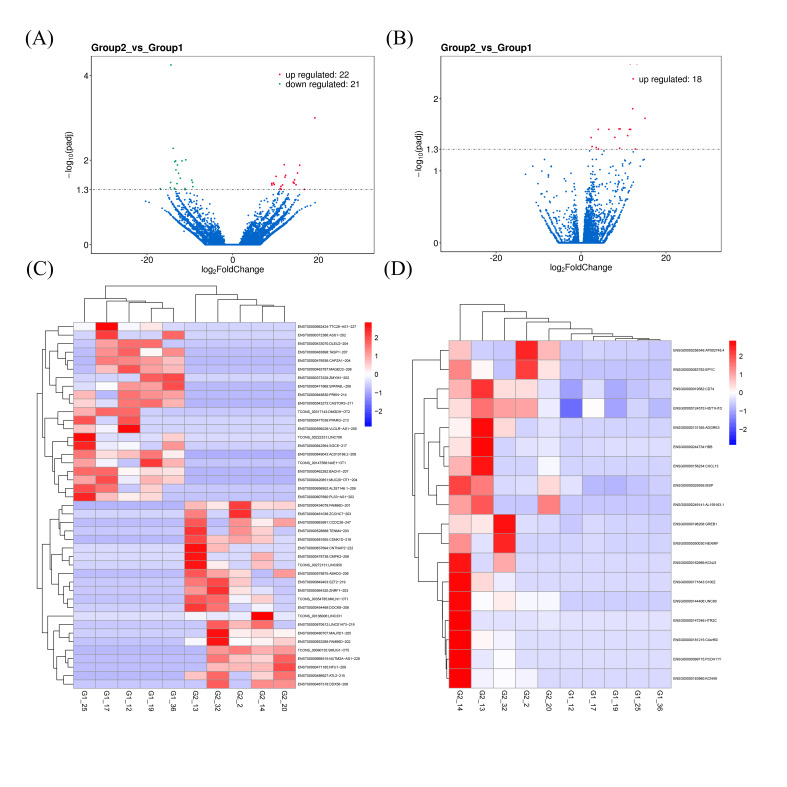
Figure 1.
The profile of differentially expressed genes (DEGs) in osteoblasts (OBs) from patients with multiple myeloma (MM). Volcano plot displays differentially expressed long non-coding RNAs (DElncRNAs) (A) and differentially expressed mRNAs (DEmRNAs) (B). Red and green points correspond to upregulation and downregulation, respectively. Heatmap shows the DElncRNAs (C) and DEmRNAs (D). The color scale represents the expression levels of DElncRNAs/DEmRNAs. Group 2 represents patients with MM, whereas group 1 represents healthy controls.

