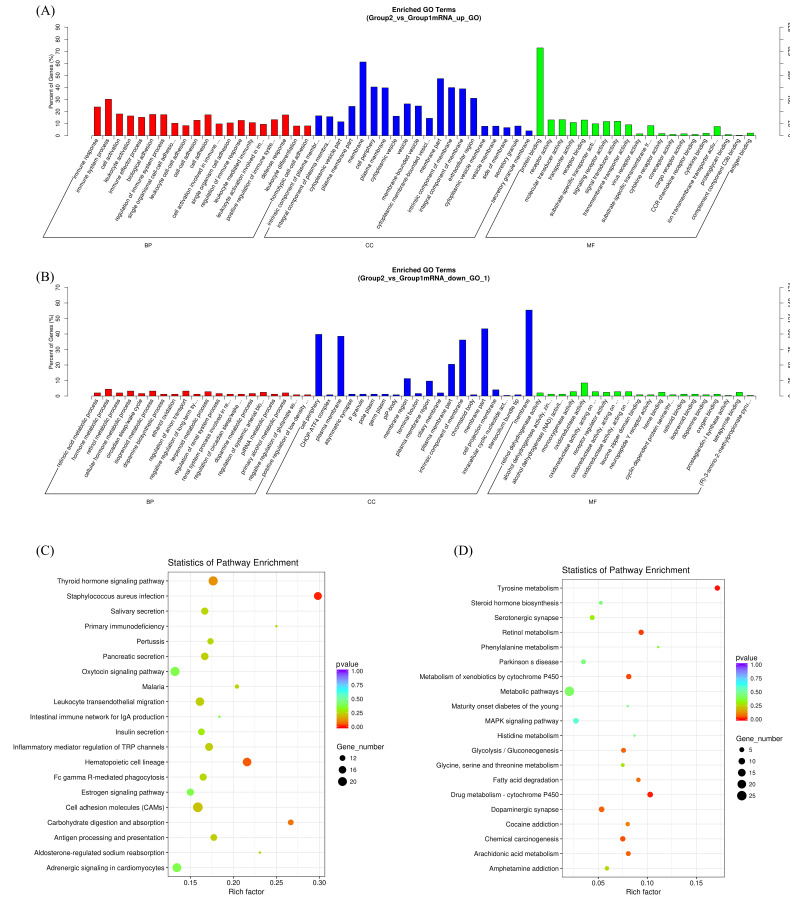
Figure 2.
Enrichment analysis of differentially expressed genes (DEGs). Gene Ontology (GO) analysis identifies enriched terms for the upregulated (A) and downregulated DEGs (B). Kyoto Encyclopedia of Genes and Genomes pathways analysis identifies enriched pathways for the upregulated (C) and downregulated genes (D). Group 2 represents patients with multiple myeloma (MM), whereas group 1 represents healthy controls.

