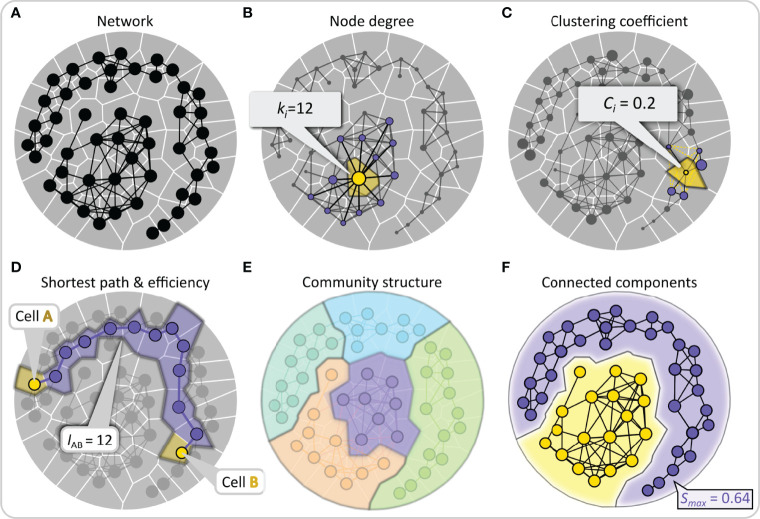
Figure 3.
Quantifying intercellular connectivity patterns with conventional network metrics. (A) Schematic representation of a multicellular system as a network composed of nodes (cells) and edges (connections or functional associations between cells). (B) Nodes are scaled based on the number of the neighbors to which they are directly connected, i.e., their degree. This feature is shown schematically for the yellow node, with the direct neighbors colored purple. (C) The clustering coefficient describes the tendency of nodes to cluster together and is defined as the number of existing connections between the neighbors of that node divided by the number of all possible connections between them. This property is illustrated by the example of the yellow-colored node, to which non-existing yellow edges between the purple neighboring nodes have been added. (D) The shortest path length between any two nodes is the number of edges that form the shortest path between them. Lower average shortest paths of a network indicate more efficient communication abilities. This feature is highlighted by two yellow nodes representing the source and destination nodes and the purple-colored nodes forming the shortest path. (E) A community consists of a group of nodes that have a higher connection density compared to the whole network. A well-pronounced community structure implies an internal network organization into functional modules. In panel (E), nodes are color-coded according to their membership in a community. (F) A group of nodes that are directly or indirectly connected to each other forms a connected component and stands for reachability within the network. The relative largest connected component representing the fraction of nodes that are connected either directly or indirectly is denoted by S max.

