Figure 7.
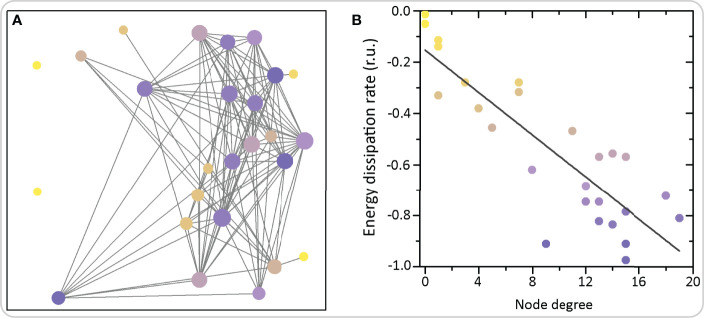
Functional network architecture of beta cells and the corresponding energy dissipation rates. (A) Each circle represents the physical position of a cell inside the islet and the connections signify functional connections. Colors of circles denote the average dissipation rates calculated as the sum of Lyapunov exponents (see Ref (167). for further details). (B) The average dissipation rate reflecting the rate of energy consumption of individual cells as a function of the node degree, i.e., number of functional connections. The grey line denotes the linearly decreasing trend showing that highly connected nodes exhibit higher dissipation and energy consumption rates.

