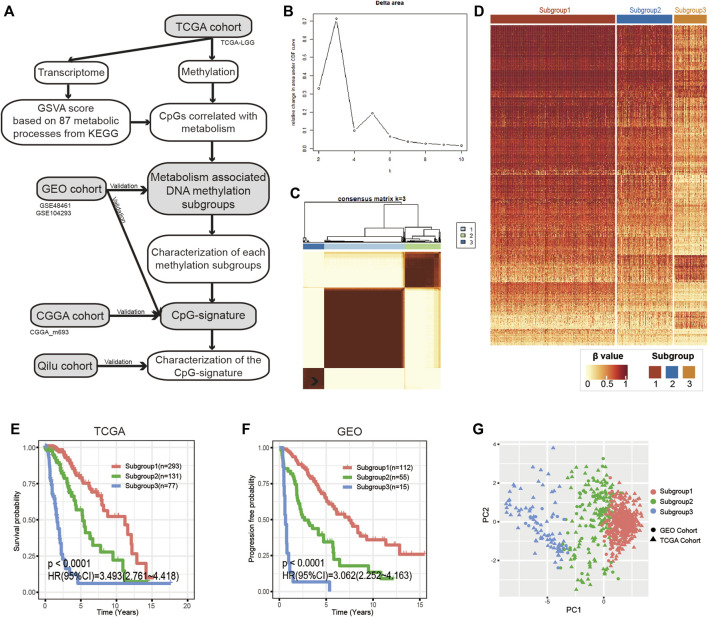
FIGURE 1.
Identification of metabolism-associated DNA methylation patterns. (A) Flowchart of the research. (B) Relative changes in the area under the CDF curve when k ranges from 2 to 10. (C) Consensus matrix heatmap of the three distinct subgroups in the TCGA cohort. (D) Heatmap of metabolism-associated CpGs in the three subgroups of the TCGA cohort. (E,F) Kaplan-Meier analysis of the three subgroups in the TCGA cohort and the GEO cohort. (G) PCA of metabolism-associated CpGs to demonstrate the three subgroups in the TCGA and GEO cohorts. CDF, cumulative distribution function; PCA, principal component analysis.

