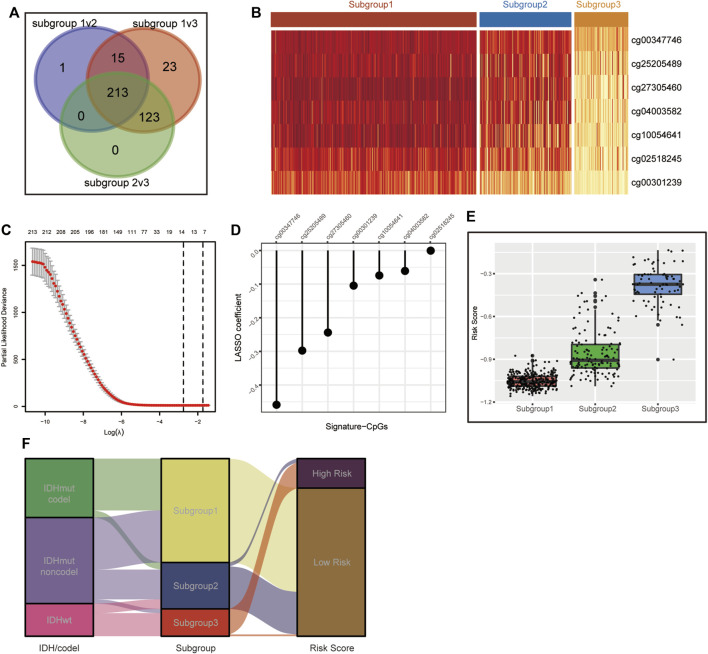
FIGURE 3.
Construction of the CpG signature. (A) Venn diagram illustrating the 213 metabolism-associated CpGs differentially methylated across all three subgroups. (B) Heatmap of beta values of the signature CpGs in the three LGG subgroups in TCGA. (C) Plot of correlation between partial likelihood deviance and lambda value in LASSO regression. The maximum lambda value within the one standard error of the partial likelihood deviance minimizer was determined as the optimal value. (D) Signature CpGs and corresponding LASSO coefficients. (E,F) Boxplot (E) and Sankey diagram (F) demonstrating the correlation of the CpG signature and metabolism-associated subgroups in TCGA.

