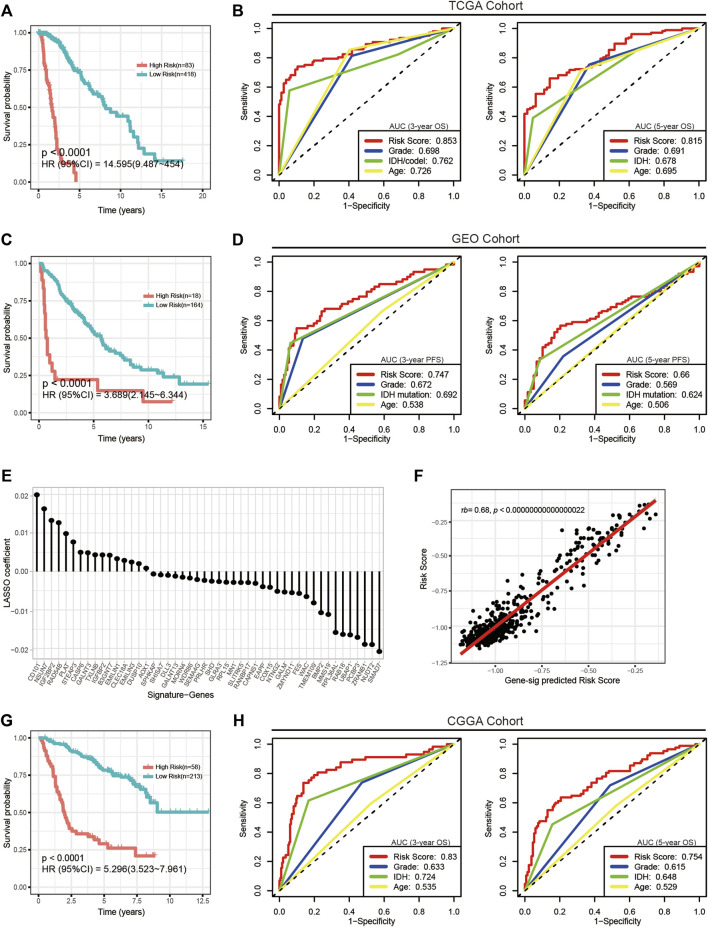
FIGURE 4.
Evaluation of the CpG signature in the TCGA, GEO and CGGA cohorts. (A,G) Kaplan-Meier analysis stratifying overall survival in the TCGA (A) and CGGA (G) cohorts. (C) Kaplan-Meier analysis stratifying progression-free survival in the GEO cohort. (B,H) ROC curves and AUC values showing the performance in predicting 3-year (left) and 5-year (right) survival in the TCGA and CGGA cohorts. (D) ROC curves and AUC values showing the performance in predicting 3-year (left) and 5-year (right) progression. (E) Signature genes and corresponding coefficients in the alternative gene signature. (F) Plot of the correlation between the alternative gene signature predicted risk scores and actual risk scores calculated by the CpG signature. τb, Kendall’s tau-b.

