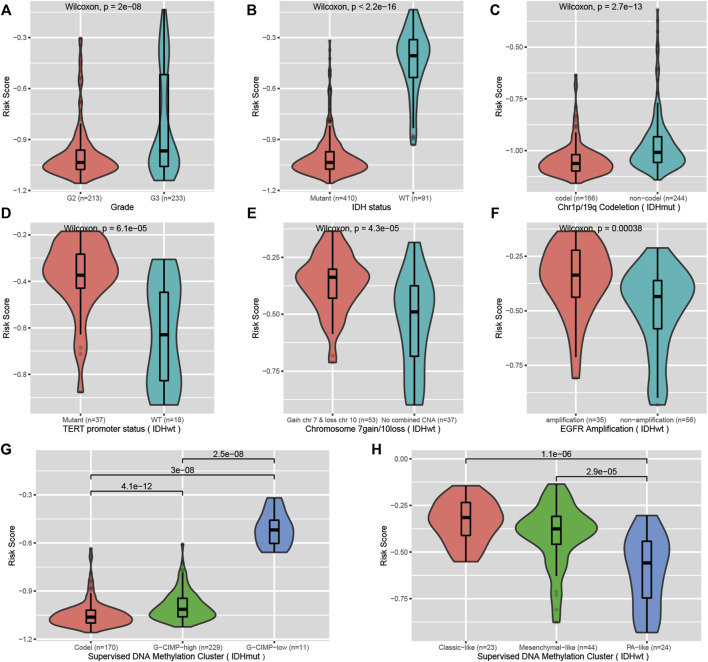
FIGURE 5.
Correlation of the CpG signature with common clinical features. (A,B) Distribution of the risk scores in LGGs stratified by histological grade and IDH mutation status. (C,G) Distribution of the risk scores in IDH-mutant LGGs stratified by chromosome 1p/19q codeletion status and supervised DNA methylation cluster. (D–F,H) Distribution of the risk scores in IDH wild-type LGGs stratified by TERT promoter status, chromosome 7gain/10loss, EGFR amplification and supervised DNA methylation cluster.

