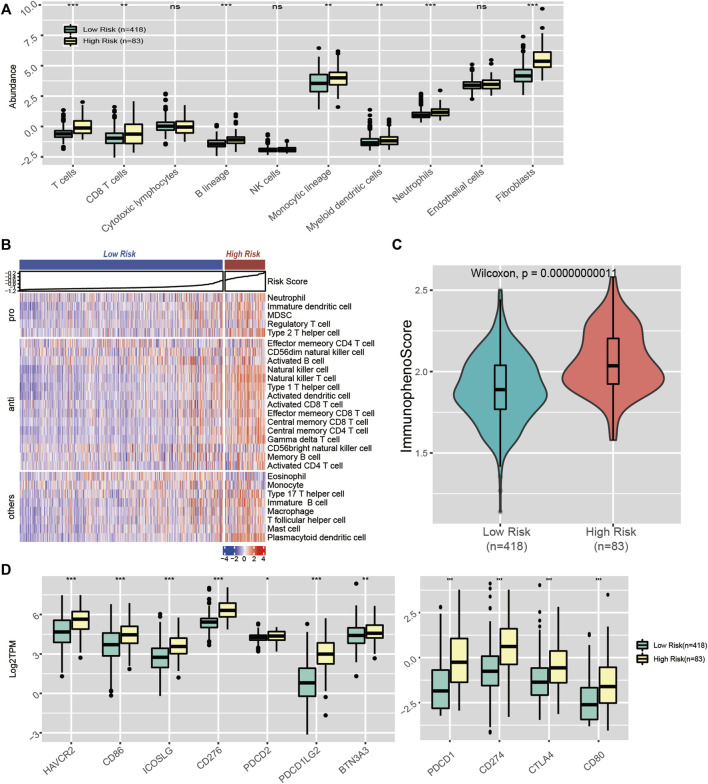
FIGURE 9.
Immune landscape in CpG signature-stratified LGGs. (A) Boxplot of the abundance of 10 immune cell subsets estimated by MCP-counter. (B) Heatmap of the enrichment scores of 28 immune cell subsets generated by ssGSEA. (C) Violin plot showing the distribution of immunophenoscores in the low-risk and high-risk groups. (D) Expression levels of 11 immune checkpoint genes in the low-risk and high-risk groups.

