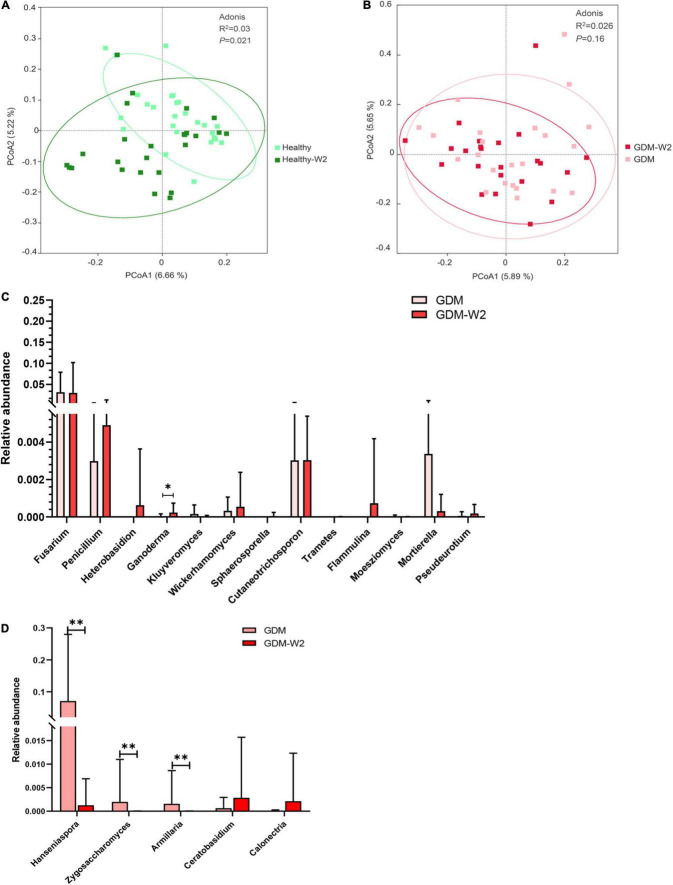
FIGURE 4.
The microbial pattern between two time points. (A) Principal coordinate analysis (PCoA) at the OTU level between the healthy and healthy-W2 groups (n = 26). (B) Principal coordinate analysis (PCoA) at the OTU level between the GDM and GDM-W2 groups (n = 23). (C) Relative abundance of probiotic genera, in the GDM samples with or without diet intervention. Mann-Whitney test. (D) Relative abundance of genera positively related with metabolic scores, in the GDM samples with or without diet intervention. Mann-Whitney test, **P < 0.01, *P < 0.05.

