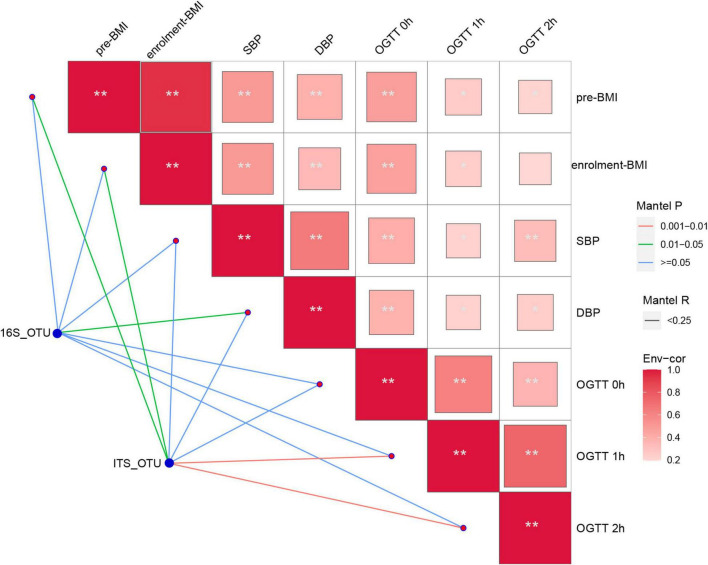
FIGURE 5.
Fungal OTUs and the 16S OTUs associated with clinical metabolic parameters was determined by Mantel analysis. The co-occurrence network shows the correlations of the fungal and bacterial microbiota with the clinical metabolic parameters. The color of lines between nodes indicate significant (red line: positive correlations with P < 0.01 and green line: positive correlations with P < 0.05) or non-significant (blue line) correlations. Blue nodes: bacterial and fungal microbiota involved in GDM group; red nodes: the clinical metabolic parameters. Asterisk in square indicating relationship between the clinical metabolic parameters, **P < 0.01, *P < 0.05.

